The 200 EMA Multiple Timeframe Forex Trading Strategy is a trend trading system based on the 200 exponential moving average indicator.
Because this is a multiple timeframe forex trading system, you require 3 timeframes to implement this system:
- daily timeframe
- 4hour timeframe
- and the 1 hour timeframe
Background
One of the first difficulties encountered by new forex traders is the determination of trend just based on price action…which means one has to study the Dow Theory of Trends.
However, the easiest process of determining what type of trend is by the use of a moving average. In this case, the use of 200 EMA determines what the trend is based on where price is in relation to it.
The whole idea of this trading system is to make sure that you trade with the larger trend that can be seen in the daily timeframe: if the trend in the daily timeframe is up, you want to be only looking for buy signals.
If the trend in the daily timeframe is down, you want to be looking for only sell signals.
Currency Pairs required? You can trade any currency pair with this 200 EMA Multiple Timeframe Forex Trading Strategy.
Buy Trading Rules
Ok, here are the trading rules when the trend is up (you only look for buying opportunities):
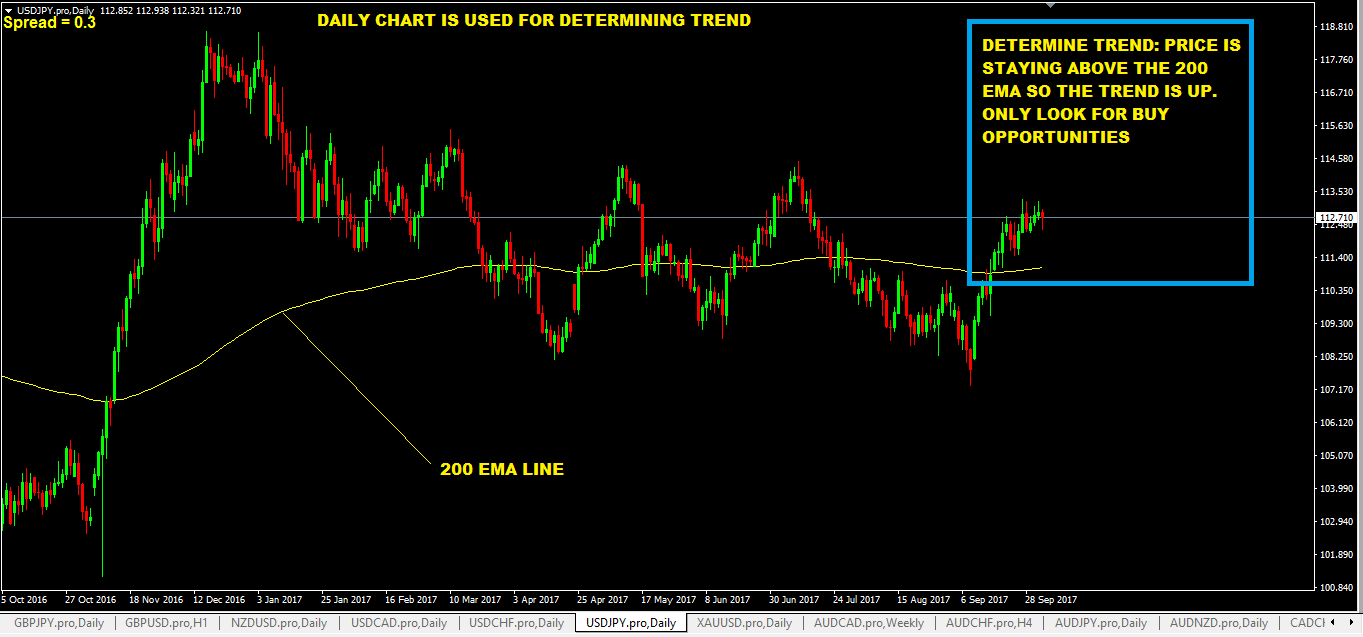
- open up your daily chart and if the price is moving above the 200 ema, that means the trend is up
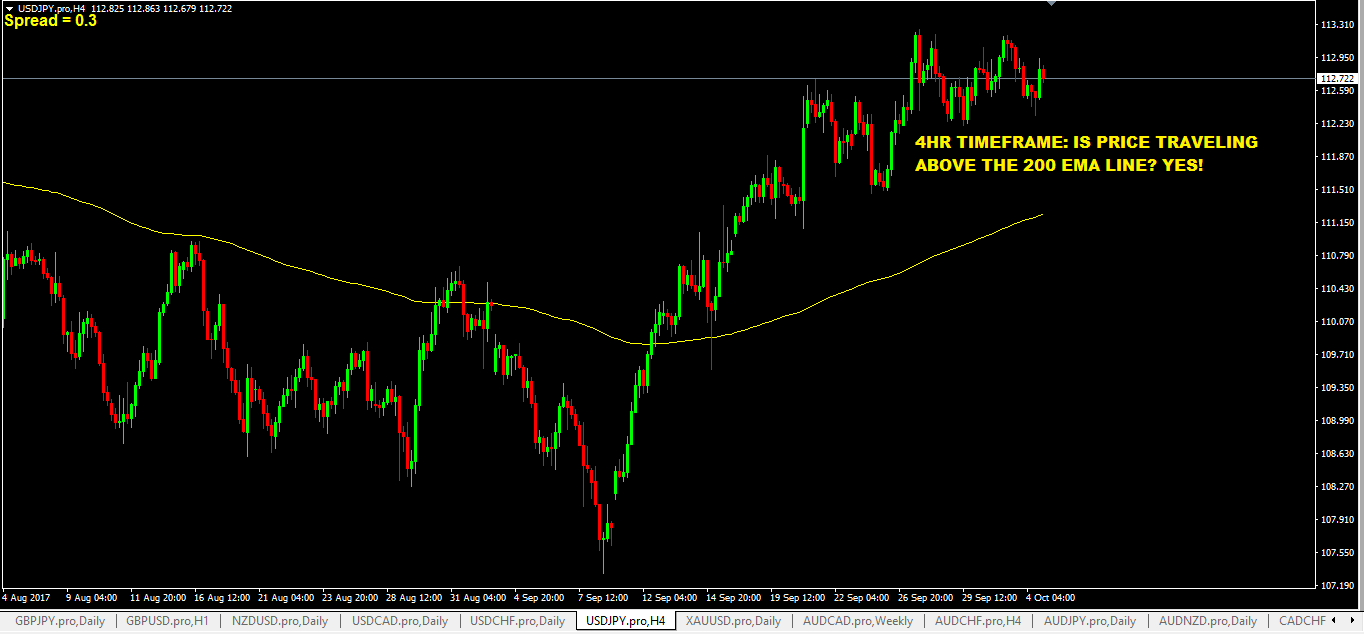
- the next thing you do is open up the 4hr chart and make sure that price is also staying above the 200 ema.
- then you switch to the 1hr chart and simply do the same as you did in the 4hr chart: make sure that price is traveling above the 200 ema.
- The 1 hr timeframe is where you wait to buy: the buy signal is the candlestick that comes down and hits the 200 ema line and bounces up, meaning, it breaks the high of the previous candlestick. Or the signal candlestick can also be a bullish reversal candlestick that forms when it hits the 200 ema line.
- For stop loss, place it 5-10 pips below the low of the bounce candlestick / bullish reversal candlestick
- For take profit: use previous swing high points or otherwise use risk:reward of 1:3 to calculate where to place your take profit order.
This first chart below shows the daily chart: this is where you determine the trend based on where price is in relation to the the 200 ema. In this case, the trend is up.
Now, you switch to the 4hr chart and make sure that price is also traveling above the 200 ema:
The entry timeframe is the 1 hr chart: this is where you wait for the signal to buy:

Sell Trading Rules
Ok, here is the trading rules when the trend is down(you only look for selling opportunities):
- open up your daily chart and if the price is moving below the 200 ema, that means the trend is down
- the next thing you do is open up the 4hr chart and make sure that price is also staying below the 200 ema.
- then you switch to the 1hr chart and simply to the same as you did in the 4hr chart: make sure that price is traveling below the 200 ema.
- The 1 hr timeframe is where you wait to sell: the sell signal is the candlestick that comes up and hits the 200 ema line and bounces down, meaning, it breaks the low of the previous candlestick. Or the signal candlestick can also be a bearish reversal candlestick that forms when it hits the 200 ema line.
- For stop loss, place it 5-10 pips above the high of the bounce candlestick / bearish reversal candlestick
- For take profit: use previous swing low points or otherwise use risk:reward of 1:3 to calculate where to place your take profit order.
Bullish And Bearish Reversal Candlestick Patterns : Better Option For Trade Entries
In my opinion, it is better to use bullish and bearish reversal candlestick patterns as your buy or sell signal when price hits the 200 ema line.
If you don’t know what reversal patterns to look for, check this out: Top 12 forex reversal candlestick patterns every forex trader needs to know.
Disadvantages of 200 EMA Multiple Timeframe Forex Trading Strategy
- like all forex trading strategies, each trading system has certain weaknesses based on market condition (s) and for this trading system, it will perform poorly in ranging market or sideways market conditions, giving you many false signals.
Advantages of The 200 EMA Multiple Timeframe Forex Trading Strategy
- trading in the direction of the main trend seen in the daily chart means you are not fighting the main trend.
- the use of reversal candlestick can really enhance your trade entries.
Don’t forget to share this 200 ema multi timeframe trading system by clicking those sharing buttons below. Thanks.