The head and shoulders chart pattern forex trading strategy is based on the bearish reversal pattern called the head and shoulders pattern.
The head and shoulders chart pattern forex trading strategy is completely opposite to the inverse head and shoulders chart pattern forex trading strategy.
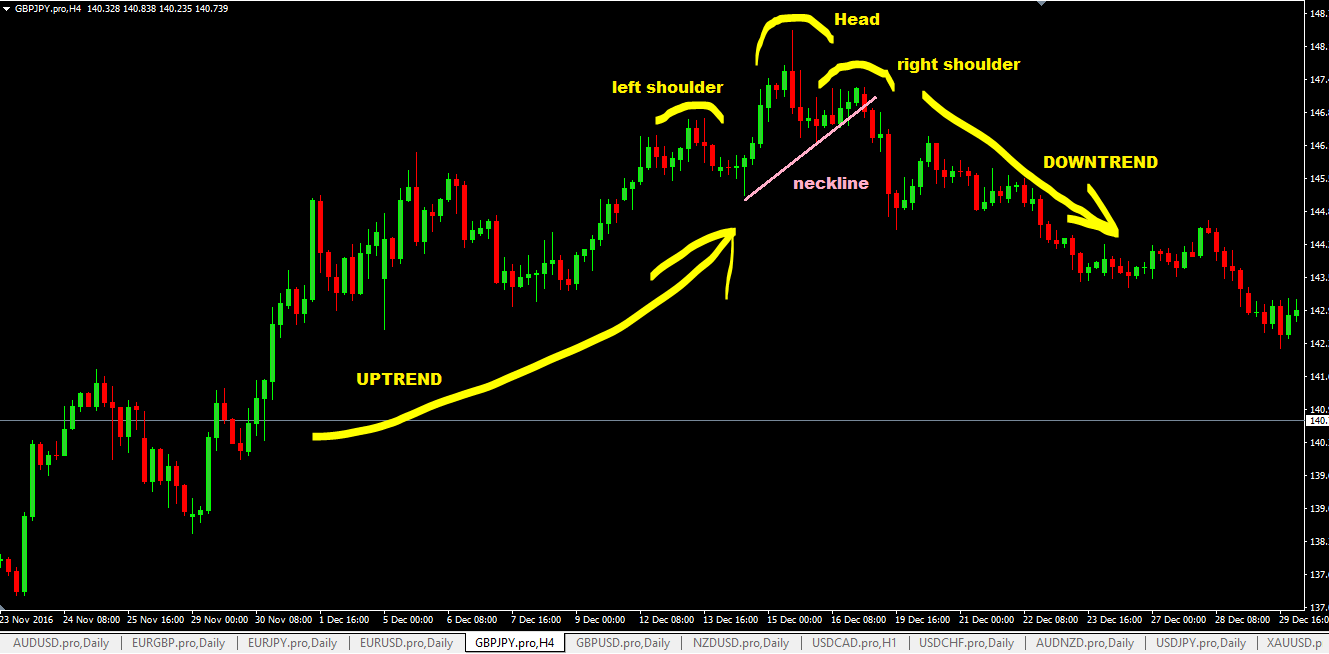
The head and shoulders pattern forms in an uptrend and when you see it forming, it indicates a potential that the uptrend may now be changing to downtrend.
Trading Parameters
Currency Pairs To Trade?
You can use the head and shoulders pattern forex trading strategy to trade any currency pairs.
Timeframes To Trade?
You can trade any timeframe but I suggest you use 15 minute timeframe and above.
Any Forex Indicators Required?
No forex indicators required for this trading system.
What Does A Head And Shoulders Pattern Look Like?
A head and shoulders pattern has these main features:
- the two shoulders…the two shoulders must never exceed the head.
- and the head…it must always be higher than the two shoulders.
- when price moves down and makes a low and then rises up after forming the left shoulder, the low point forms the first point to draw the neckline…the second neckline point is when price moves down after forming the head, makes a low and goes up to form the right shoulder, that low point forms the the 2nd neckline point.
- the neckline is important because the breakout of that neckline to the downside completes the head and shoulders pattern.
Here are a few examples of head and shoulders patterns:
Here’s another example:
How To Trade the Head And Shoulders Chart Pattern-The Trading Rules
There are two ways you can use the trade the head and shoulders chart pattern.
Here’s option 1:
- wait for price to break the neckline trendline and as soon as a that breakout candlestick closes below that neckline, place a pending sell stop order at least 1- 2 pips below its low.
- place your stop loss at least 5 to 10 pips or more above the high of the breakout candlestick.
- for the profit target, you can use risk:reward of 1:3 or another options would be to calculate it as show on this diagram:
Here’s option 2:
With option 2, you wait for price to break the neckline trendline and then wait for it to reverse up and touch that neckline trendline.
- then place your pending sell stop order at least 1-2 pips under the low of the candlestick that touches the neckline. Best option would be to watch for bearish reversal candlestick patterns as your signal to do that.
- place stop loss at least 5-10 pips or more above the high of the candlestick that you placed the pending sell stop pending order.
- For take profit target calculation, you can use do as shown on the chart above.
Advantages of The Head And Shoulders Pattern Chart pattern Forex Trading Strategy
- good risk to reward outcome if price moves as anticipated.
- head and shoulders chart pattern in larger timeframes like the daily when they form, can see the price heading down for hundreds to thousands of pips and if you happen to get into a trade and ride it, you will be smiling all the way to the bank (as the saying goes!)
Disadvantages of The Head And Shoulders Chart Pattern Forex Trading Strategy
- beginner forex traders can have a hard time trying to identify the head and shoulder patterns forming on charts.
- spikes/whipsaws can happen on initial breakout or on the pullback (to test the neckline) and this get hit your stop loss.
- the breakout candlestick on the neckline can be very long which means your stop loss distance will also be huge so you need to reduce your contract sizes to a reasonable level to minimize your trading risk to an acceptable level.
Don’t forget to share with your friends by clicking those sharing buttons below. Thanks.