Many beginner forex traders do not know how to draw trendlines the right way.
In this article, I will show you:
- how to draw the best trendlines
- what types of points are the best points to pick to draw trendlines.
- why you should be very careful about the steepness of the trendlines.
- why the distance between two points needed to draw trendlines is extremely important.
- amazing examples of how prices bounces off trendlines creating great trading opportunities to make hundreds of pips of profit (if you know how to draw trenldines and trade with trendlines)
The core forex trading system I use to trade forex is the trendline trading strategy.
I’ve been into forex trading for a number of years now and based on my experience of testing out many different forex trading strategies, this system has the best risk:reward ratio. In addition to that, it is a system that allows you to sell at the very top and buy at the very bottom because you will enter trades just when a trend is ending.
Drawing trendlines is not difficult. It is just a line connecting a minimum of two points on your charts. The difficult part of drawing trendlines is trying to figure out out what the relevant points to use to draw trendlines…and that is what tends to confuse a lot of forex traders.
What Is A Trendline In Forex?
A trendline is simply a diagonal line that you draw at an angle, on your charts to connect a minimum of two points.
This means that, a trendline:
- is not a horizontal line
- is not a vertical line
Main Purposes Of Trendlines
Trendlines are a great tool for technical analysis purposes.
And the main purposes of trendlines are these:
- trend indentification
- confirming the existence/non-existence of a trend.
- trading off the bounce up/down of trendlines
- trade exit tool (if price breaks a trendline, it warns you that “maybe now is the time to get out of a trade” and take your profits)
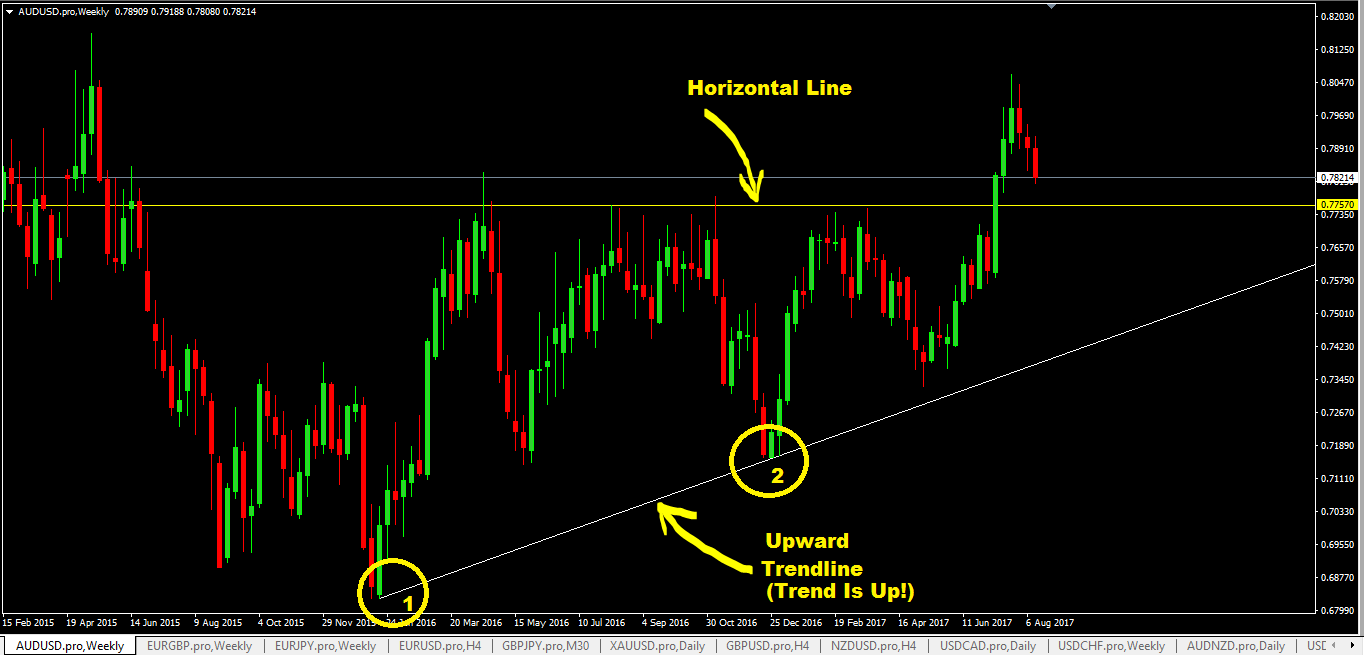
There are two types of trendlines, an upward trendline and a downward trendline.
Upward Trendlines
- Upward trendlines, when drawn, indicate the market is in an uptrend.
- If the prices come down and hit the upward trendline and keep bouncing up, you know that the uptrend market is still on.
- But when an upward trendline gets intersected and broken, it indicates that the market is now turning into a downtrend market so you should be thinking of exiting your “buy” trades that are in profit or move stop loss and lock in profits.
- To draw an upward trendline, look for two previous swing lows (bottoms) and connect them. That’s it.
Downward Trendlines
- Downward trendlines indicate market in a downtrend as long as price keeps coming up to it, hitting it, and falling back down.
- But if a downward trendline gets instersected and broken, you should know that the downward market is most likely ended and now the market may be going up.So you should be taking your profits off the sell trades that you have or move stop loss tighter.
- To draw a downward trendline, look for two previous swing highs (peaks) and connect them with a line.
How To Draw The Best Trendlines
The best trendlines I’ve found (based on my experience) are those trendlines that I’ve drawn after I’ve considered the following 3 things:
- larger timeframes: trendlines on larger timeframes tend to have better outcomes.
- the angle of steepness of the trendlines: it should be less than 30 degrees, very steep trendlines are unstable and price cannot be sustained in this manner for a long.
- the distance between the 2 points used to draw trendlines: they must be spaced reasonable apart (not too close!)
Once you’ve got the 3 things above considered, the process of drawing a trendline is really simple.
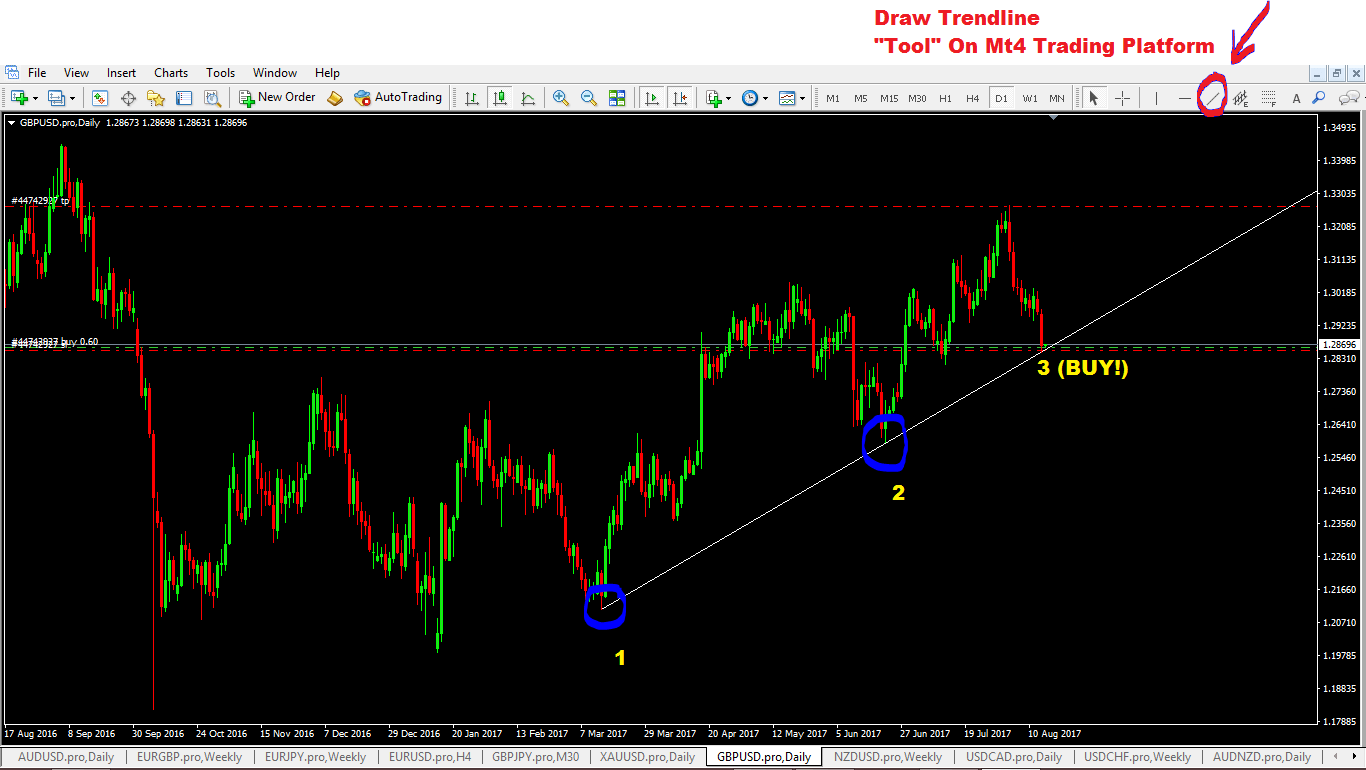
If you are using the MT4 trading platform, the process is really simple. Here are the steps of how to draw an upward trendline:
- Identify 2 points(swing lows numbered 1 & 2)
- Click the “draw trendline” icon and connect the two points.
For drawing downward trendline, you do the exact opposite.
How to trade from trendlines: once you’ve drawn your trendline, you wait to buy (or sell) when price comes to it on the 3rd, 4th, 5th point etc along that trendline.
Separation Distances Between Point 1,2 & 3
I generally prefer to make sure that when I draw trendlines:
- the distance between point 1 and 2 is not too close and not too far apart but should be reasonable spread wide apart that you can actually see them on your chart screen without zooming to minimize or changing to another timeframe to see the 2nd point.
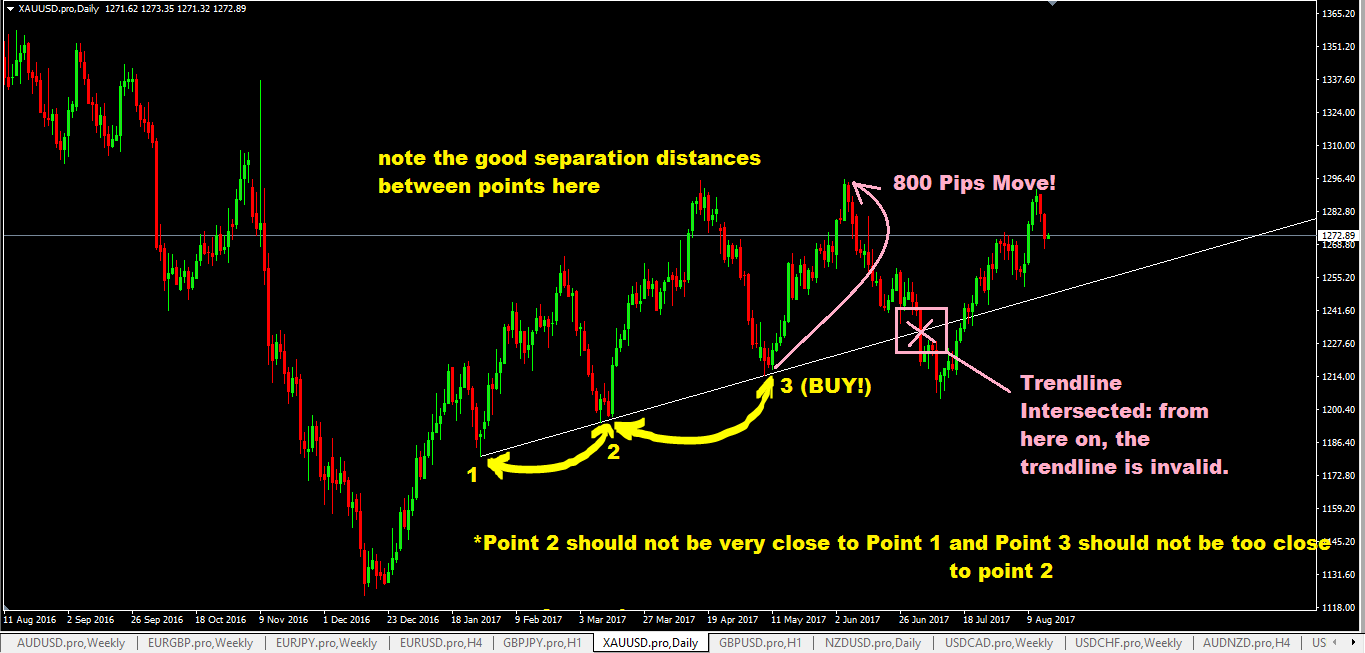
- there should be a good separation distance between point 1 and 2 and similarly between point 2 & 3. Note point 3 is where you buy or sell.
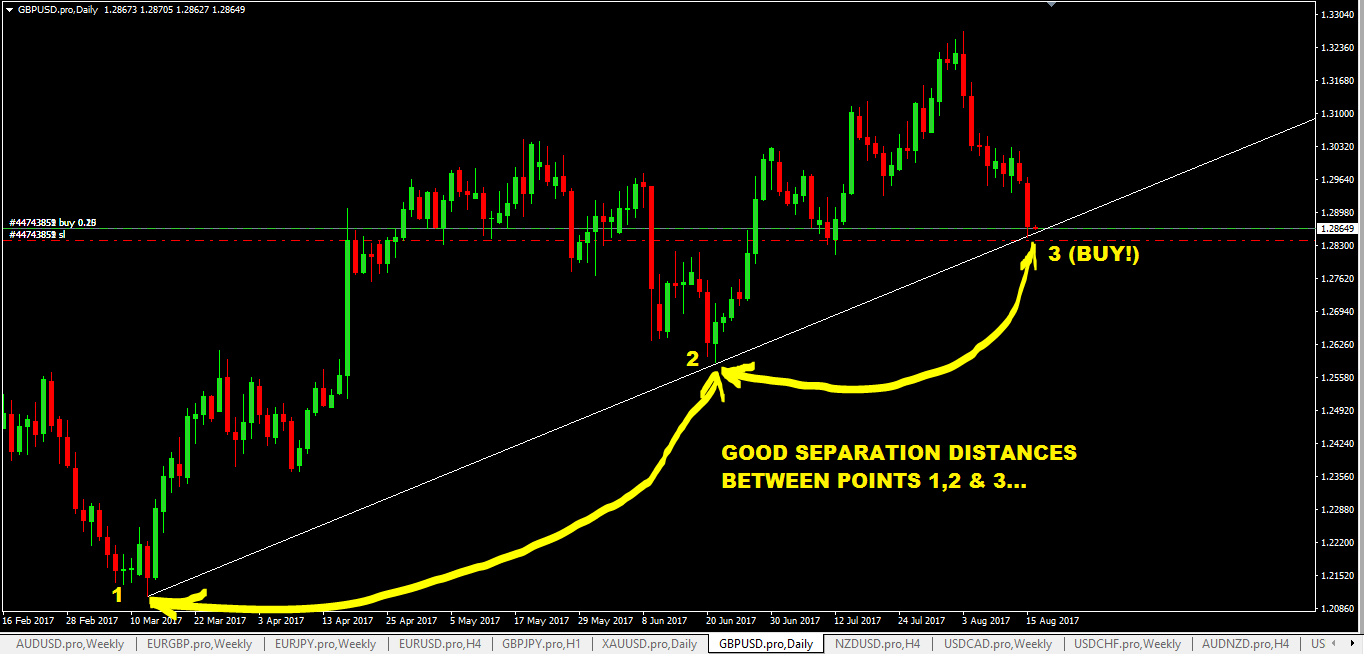
Here’s another example of good separation distances you should be looking for:
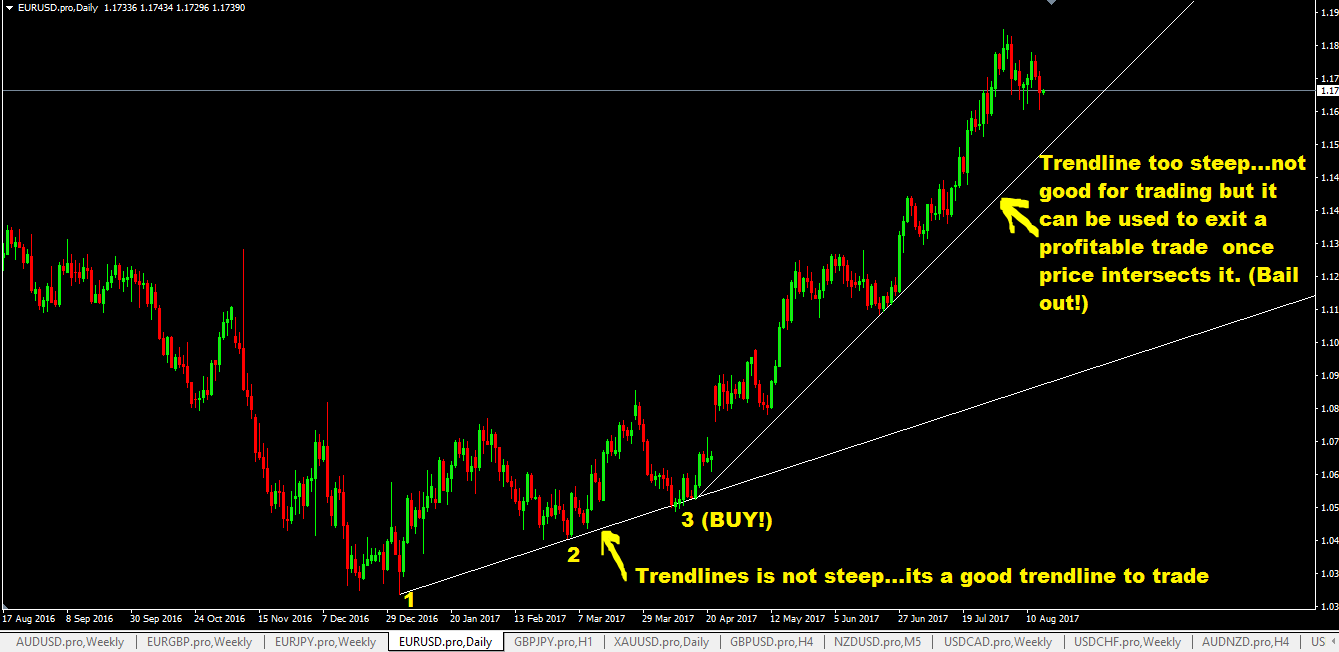
The Steepness of The Trendline
What I find is that, the steeper the trendline is, the more unreliable that trendline becomes so I completely ignore trading off such steep trendlines.
Why? Because price cannot be sustained at that steepness for long. Soon is will break that steep trendline and get back to its “normal.”
So what is considered a steep trendline? As a rule of thumb, a trendline that is greater than 30 degrees is too steep. So avoid trading them. But you can use steep trendlines for trade management purposes like shown below.
Drawing Trendlines Based On Larger Timeframes
I like to draw trendlines based on larger timeframes and then switch to smaller timeframes like the 1hr, 30minustes, 15 minutes and even 5 minutes, to look for reversal candlestick patterns as my signal to buy or sell. This technique is called multiple timeframe trading.
When I want to start my technical analysis of drawing trendlines, I start with the largest timeframe first. In this case, it will be the monthly timeframe.
So what you do is start looking at the monthly timeframe chart and see if you can identify swing highs and swing lows (points 1 & 2) where you can draw trendlines on. After you’ve drawn trendlines, ask yourself this question: how soon is price going to reach that trendline? in 3-6 months time?
That’s too long…forget it!
But know what is happening so when the time comes, you have to go back and draw that trendline. But if you think that price may touch the trend line with a few days to few weeks, then keep that trendline on. Its acts as your visual reference and a reminder that a trendline trading setup is happening and for you to keep checking.
Now work you way down to the next timeframe, the weekly. Usually, what you draw in the monthly time frame can also bee seen in the weekly timeframe. Then go down do the daily timeframe to see if yout can spot any opportunities to draw trendlines.
Why? Well, the monthly and the weekly are larger timeframes, so they will cover up (hide) trend line trading setups that will be forming in the daily!
The last two timeframes I check are the 4hr and the 1hr. So this is the order on how to check the timeframes to draw trendlines.
Smaller Timeframe Trendlines Vs Larger Timeframe Trendlines
Be careful when you trade smaller timeframe trendlines that go against the main trendlines. This is especially true when you trade near their intersection points.
In such cases, I tend to move my stop loss closure to lock my profits and also I’d be watching the price action at the touch of the larger timeframe trendline to bail out completely from my smaller timeframe trendline trade and execute a trade on the larger timeframe.