The bullish pennant chart pattern forex trading strategy is a price action trading system based on the bullish pennant pattern.
Now you may be wondering:
what a bullish pennant chart pattern?
Well, here’s a bit of an introduction for you newbies.
Introduction To The Bullish Pennant Chart Pattern
A bullish pennant chart pattern is considered a continuation pattern that forms in an uptrend.
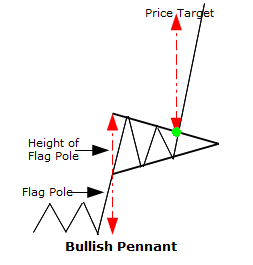
There are 3 main components of a bullish pennant pattern:
- the flag pole
- the height of the flag pole
- the profit target (should equal to the height of the flag pole)
As you may have noticed above, some traders would use the height of the flag pole to calculate the profit target.
Here’s an example of the different parts of the bullish pennant chart I was talking about:
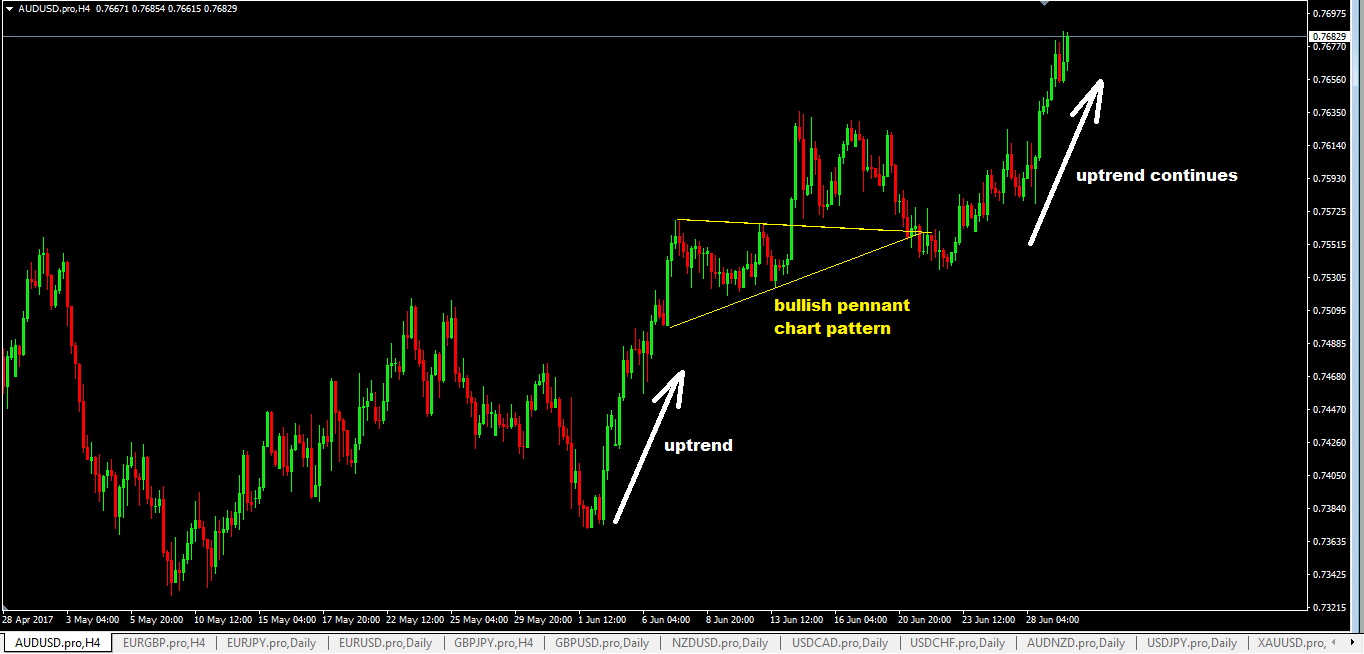
Here’s what a bullish pennant chart pattern looks like on a chart:
Currency Pairs To Trade
The bullish pennant chart pattern can form in any currency pair so there is really no restriction what currency pairs you can trade this system.
Timeframes To Trade
You can use any tiemframe to trade the bullish pennant chart pattern but I suggest you use 15 minute timeframe and above.
No forex indicators are required as this is a 100% price action trading system.
How To Trade The Bullish Pennant Chart Pattern-The Trading Rules
Trading the bullish pennant chart pattern should be relatively easy. The first thing you should make sure is that the the market is in an uptrend.
And after that strong upthrust uptrend, price will gradually come to a rest or lets call it “consolidation” while it builds its energy to the next stage of the upward move.
So how do you trade it? There’s two possible options where you can trade it and this chart below shows how:’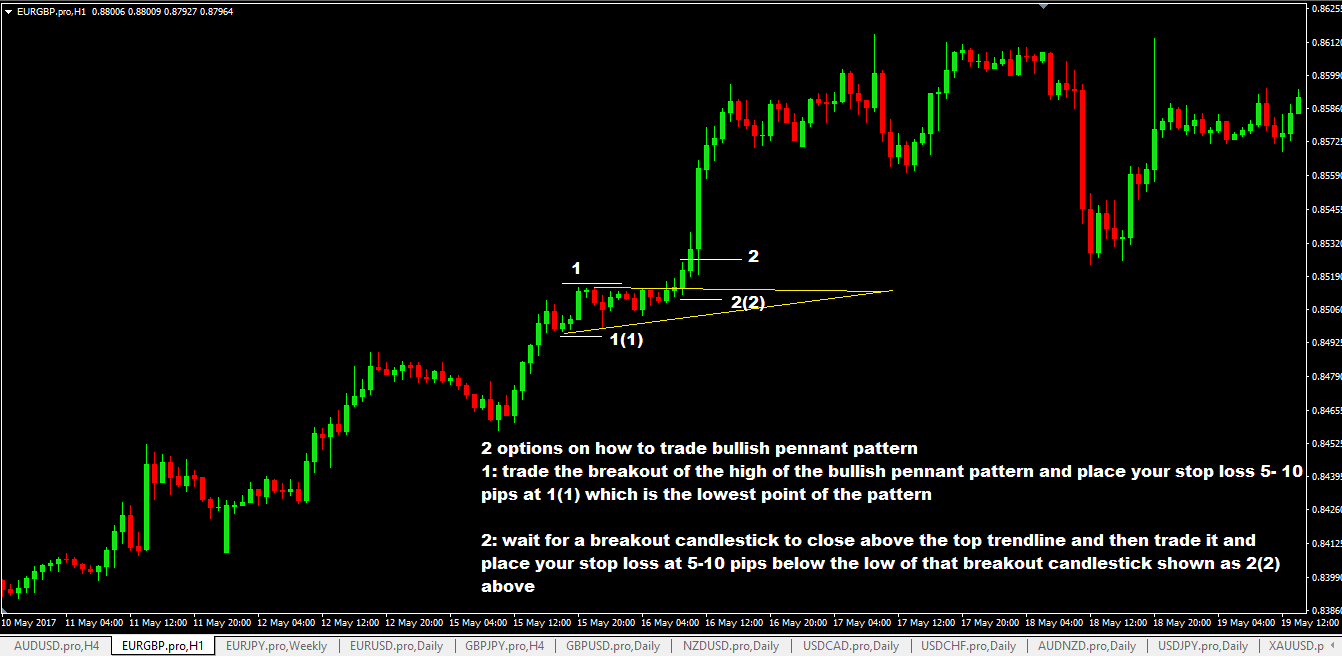
Option 1: Trade The Breakout Of The Highest Peak of the Bullish Pennant Pattern
- place you pending buy stop order at least 2 pips above the high of the highest point/peak in that pattern.
- place your stop loss at the lowest point in the pattern
- for take profit, use the height of the flag pole to calculate your take profit target level or if not, use a previous swing high as a take profit target level or you can use risk:reward ratio of 1:3 to calculate it.
Option 2: Trade The Breakout Candlestick
The breakout candlestick is the candlestick that breaks the top trendline and closes above it. When that happens:
- place a pending buy stop order 2 pips above high of that breakout candlestick
- place your stop loss at least 5-10 pips below the low of the breakout candlestick but if you think, you risk getting stopped out, move your stop loss to the lowest point i the pattern as in option 1 stop loss.
- take profit calculations are the same as that of option 1 above.
Advantages of The Bullish Pennant Chart Pattern Forex Trading Strategy
- if you think you’ve missed a strong trend move from the start, then this forex trading system allows you “hop” in along the way.
- the risk:reward ratio a good if your trade works out as anticipated.
- trading rules are really simple to understand and execute.
Disadvantages of The Bullish Pennant Chart Pattern Forex Trading Strategy
- the breakout candlestick sometimes can be very long which means your stop loss distance can be large. In such a situation, avoid trading it.
- bullish pennant patterns can be subtle and you really need to pay attention or have a good eye to see what is happening and in this regard, many new forex traders may find it difficult at first.
I hope you have enjoyed learning about the bullish pennant chart pattern and how to trade it. Please don’t forget to share, tweet etc by clicking those sharing buttons below.