The double bottom chart pattern forex trading strategy is the exact opposite of the double top chart pattern forex trading strategy.
The double bottom chart patterns are bullish reversal patterns and if found in a downtrend, they indicate the potential that the downtrend may be ending and an uptrend may be starting.
Trading Parameters
Currency Pairs To Trade? Any currency pair.
Timeframes To Trade? I suggest you use 15 minute timeframe and above.
Any Forex Forex Indicators Required? No forex indicators are required.
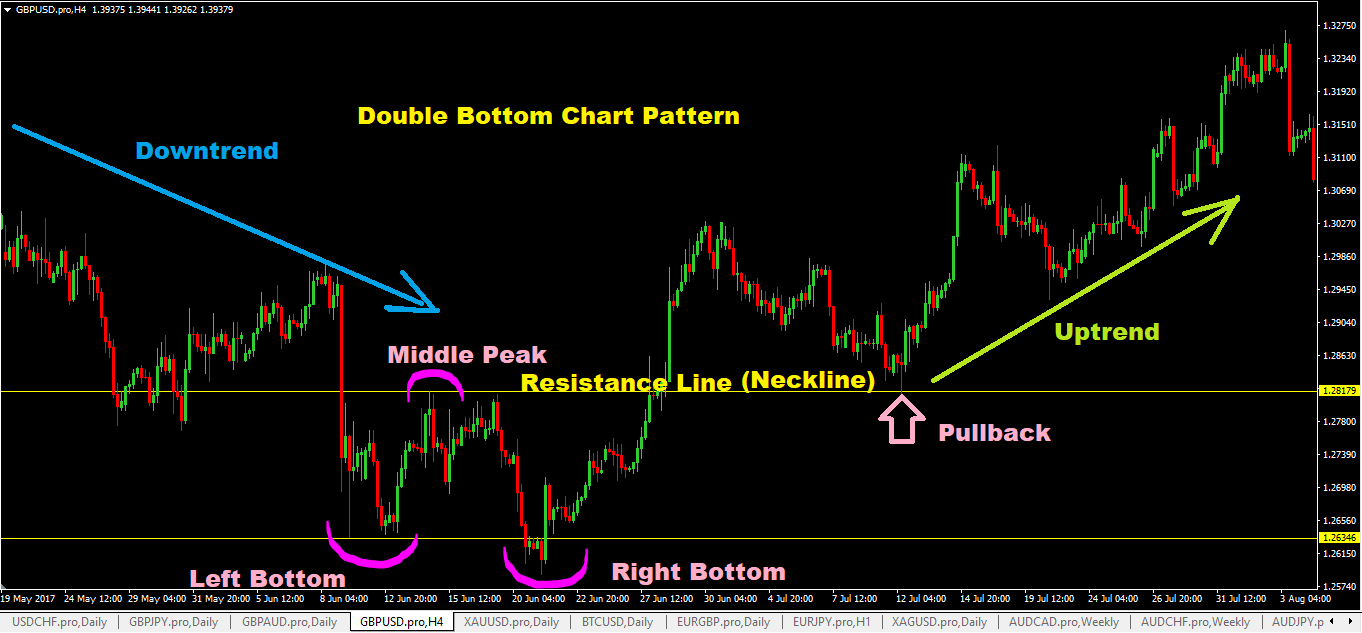
What Does A Double Bottom Chart Pattern Look Like?
A double bottom chart pattern has 3 distinct features:
- left bottom (or bottom 1)
- right bottom (or bottom 2)
- and the neckline.
The breakout of the neckline tends to see prices shooting upwards.
Here’s an example:
How To Trade The Double Bottom Chart Pattern
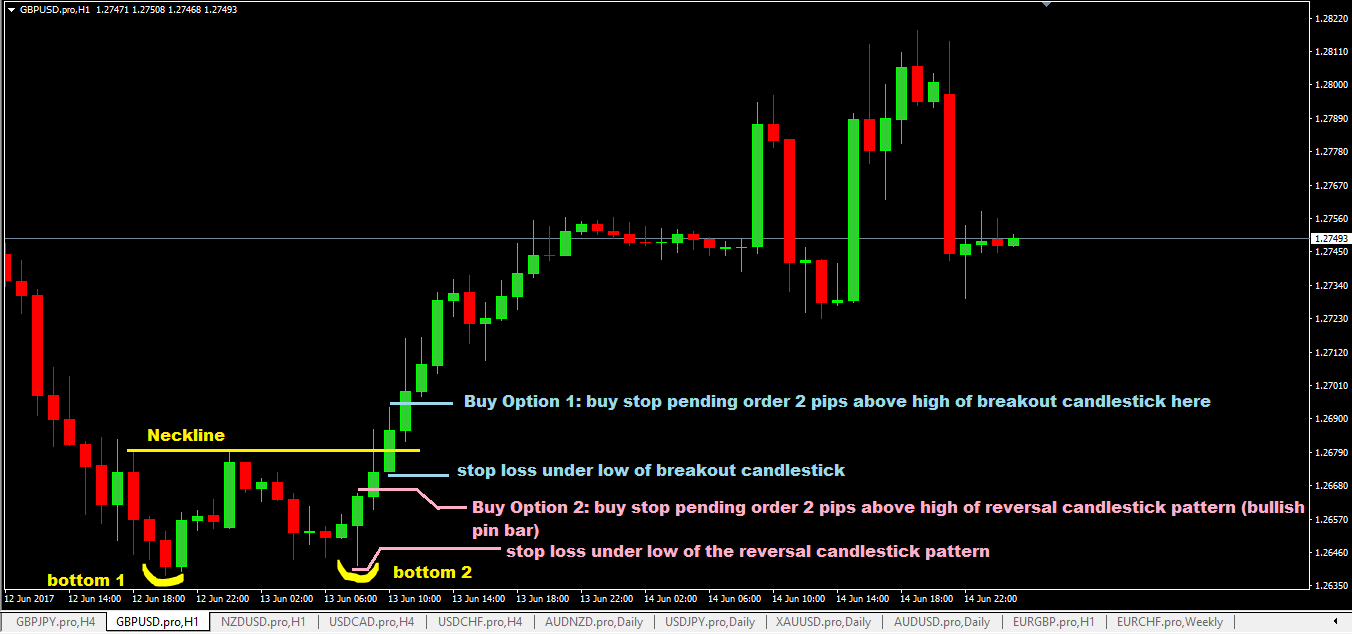
There are two ways you can trade the double top chart pattern.
Here’s Option 1:
- wait for price to break the neckline and make sure that the breakout candlestick closes above the neckline.
- place a pending buy stop order 2 pips above high of the breakout candlestick.
- place your stop loss 5-10 pips below the low of the breakout candlestick.
- for take profit, you can calculate it based on 1:3 risk:reward ratio or use previous swing high level as your take profit target.
Option 2:
Option 2 is an aggressive way of trading the double bottom chart pattern.
Why?
Because you are not waiting for the confirmation of the breakout of the neckline to tell you that it is indeed a double bottom.
What you need here is to know your bullish reversal candlestick pattern signals…these will tell you to buy.
- as price starts to head down and form bottom 2, you need to watch out for bullish reversal candlestick patterns to form
- if you spot a bullish reversal candlestick pattern then place a buy stop pending order 2 pips above high of that bullish reversal candlestick pattern.
- then place your stop loss 5-10 below the low of the bullish reversal candlestick pattern.
- take profit targets options: you can use the neckline which is your previous swing high really, to take profit, or you can use another previous swing high, higher than the neckline, or you can calculate it based on 1:3 risk:reward ratio.
Advantages of The Double Bottom Chart Pattern Forex Trading Strategy
- excellent risk:reward ratio if you use option 2 method and price goes and breaks the neckline and continues to go up.
- its a fairly easy chart pattern to spot on any charts if you are really looking for it.
- nothing complicated, the trading rules are really simple for anyone to follow.
Disadvantages of The Double Bottom Chart Pattern Forex Trading Strategy
- potential for large stop loss distance if the breakout candlestick on the neckline is too long.
- spikes tend to happen on bottom 2 to knock out stop losses that are accumulated then and then you see price shooting up! That’s forex trading so be aware of that.