Here are the top 12 forex reversal candlestick patterns that will enhance your currency trading endeavor by giving the signal to buy or sell.
In forex trading, there are 3 main ways that forex traders generate buy or sell signals based on their trading strategies. They use:
- forex indicators
- candlestick patterns, like reversal candlestick patterns.
- or forex chart patterns.
In this post, I will be focusing more on the reversal candlestick patterns.
The 12 reversal candlestick patterns given here are the ones that tend to form more frequently on forex charts and the best thing of all is they are really easy to spot once you know what you need to look for.
Now, there are two types of forex reversal candlestick patterns:
- bullish reversal candlestick patterns
- and bearish reversal candlestick patterns
Now, these reversal candlestick patterns can come in the form of:
- a single candlestick pattern
- or a pattern that is made of of 2 or more candlesticks.
Now, there’s a big difference between candlestick patterns and chart pattern: candlestick pattern usually consist of 1 or 2-3 (on average) candlesticks that form consecutively.
On the other hand, chart patterns is more to do with geometry or shapes and that can involved hundreds to even thousands of candlesticks depending on the timeframe.
Bearish Reversal Candlestick Patterns
Bearish reversal candlestick patterns when they form, indicate that the trend may be changing from bullish to bearish.
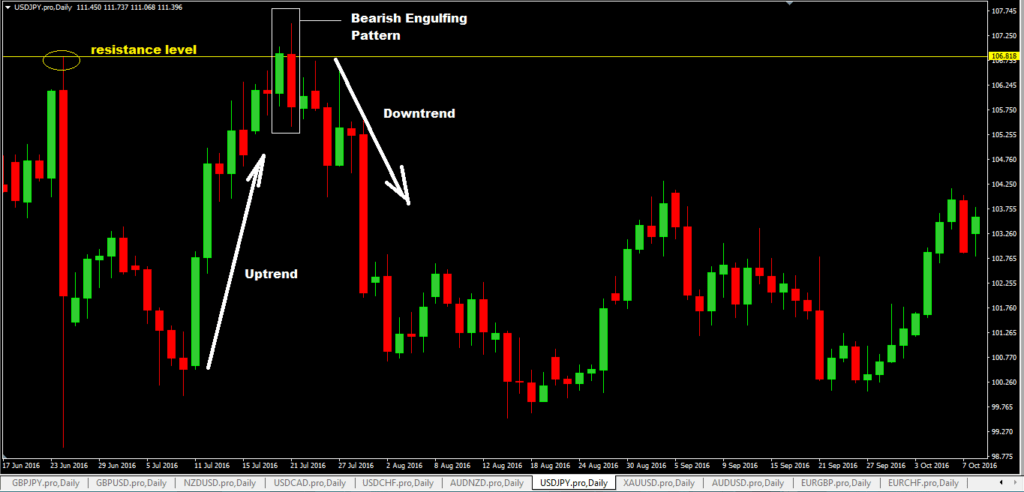
#1: Bearish Engulfing Candlestick Pattern
- the bearing engulfing pattern is a 2 candlestick pattern.
- the first candlestick is bullish but the second candlestick is bearish showing a complete change is market sentiment.
- it is important to note also here that the 2nd candlestick completely “engulfs”, the first candlestick. (lies within the shadow of the second candlestick)
- if you see this candlestick pattern form in resistance level or where you’ve drawn a downward trendline, you should be looking to sell.
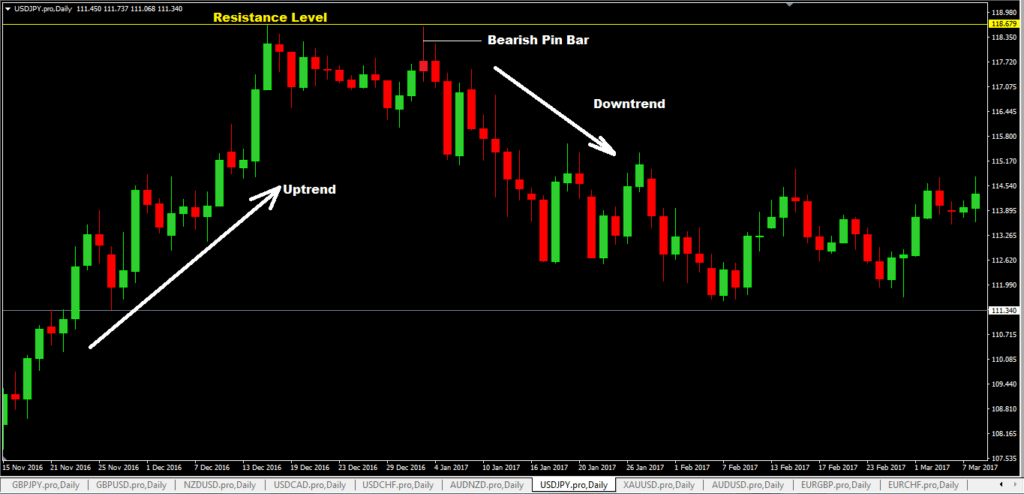
#2: Bearish Pin Bar
- the bearing pin bar is called called the shooting star, because of its shape and it is a single candlestick pattern.
- the distinct feature of this candlestick is very long tail and a very short body
- when you see a bearish pin bar form in resistance levels or on downward trendlines, fib retracement levels etc, you should be looking to sell.
#3: Bearish Harami Candlestick Pattern
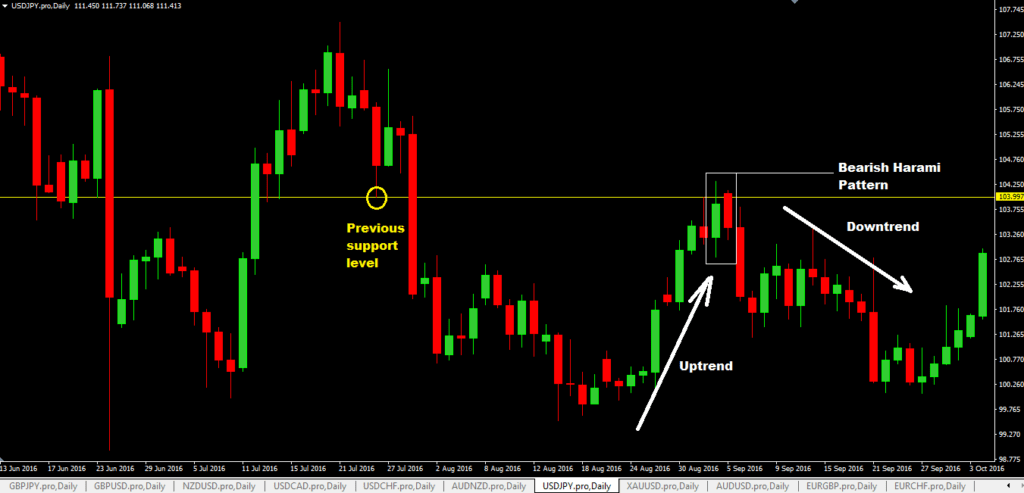
- the bearish harami pattern is the same as the bearish inside bar pattern and it is a 2 candlestick pattern.
- the first candle is bullish but the 2nd candle is bearish and it lies within the shadow of the first candlestick
- on the chart below, you see a previous support level acting as a resistance level and when price came up to it, a bearish harami pattern was formed and later price went down.
- so if you see a bearish harami pattern form in resistance level, fib retracement level, downward trendline touches, you should sell.
#4: Dark Cloud Cover Candlestick Pattern
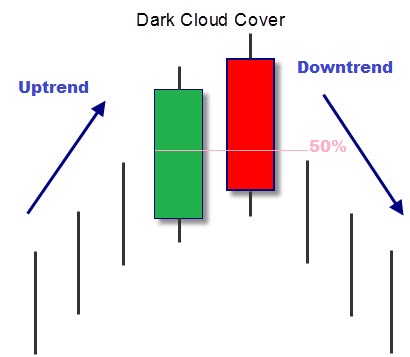
- the dark cloud candlestick pattern is another reversal candlestick pattern that is made up of 2 candlesticks.
- the first candlestick is bullish but the second candlestick is bearish and it should close at 50% or more than 50% of the length of the first candlestick.
- once you see this pattern form in resistance levels, downward trend line touches etc, you should be looking to sell.
#5: Bearish Doji Candlestick Pattern
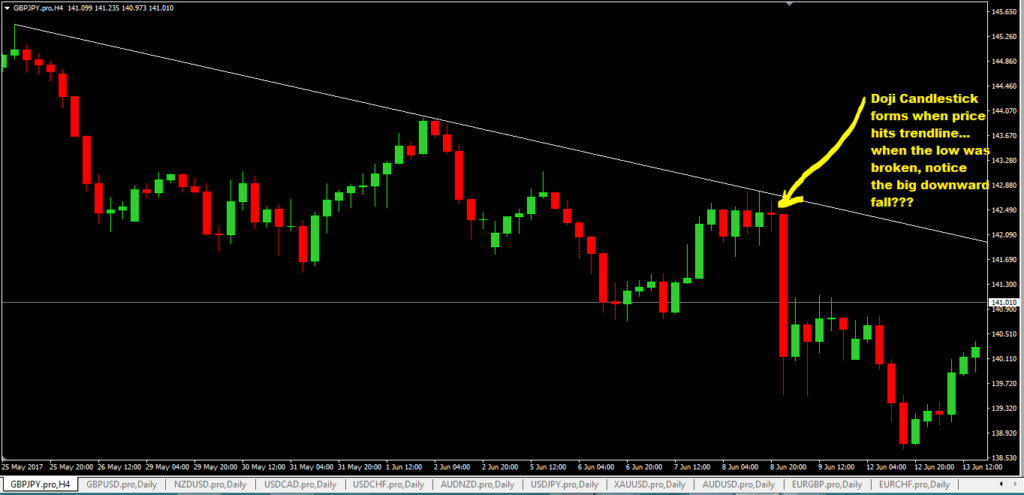
- Dojo candlesticks are generally considered neutral candlesticks but I tend to take a different view: if I see doji candlesticks form in an uptrend in levels of resistance, I take them as possible bearish reversal signals and trade the breakout of the low of that doji candlestick pattern.
- there are and handful of different types of doji candlesticks and its not the purpose of this post to cover them but maybe some other time.
- the doji candlestick is a single candlestick pattern.
- its distinct feature is that it tends to be very short and has very little to no body at all
- when you see a doji candlestick pattern form in levels of resistance, you should look to sell.
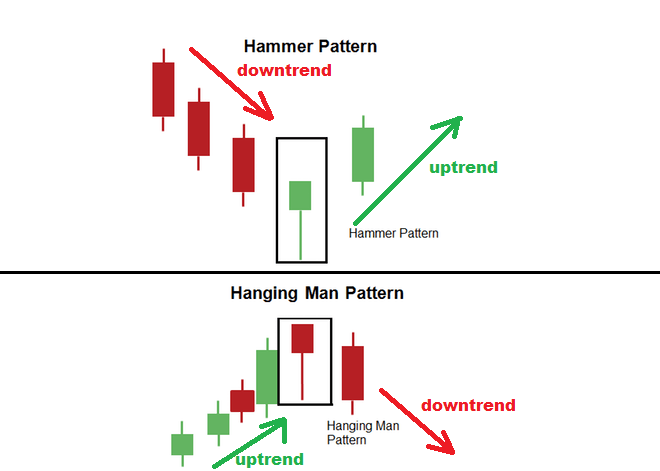
#6: Hanging Man Pattern
- the hanging man candlestick pattern is a single candlestick pattern and ideally it must form in an uptrend in levels of resistance.
- if you see this pattern, you should be looking to sell.
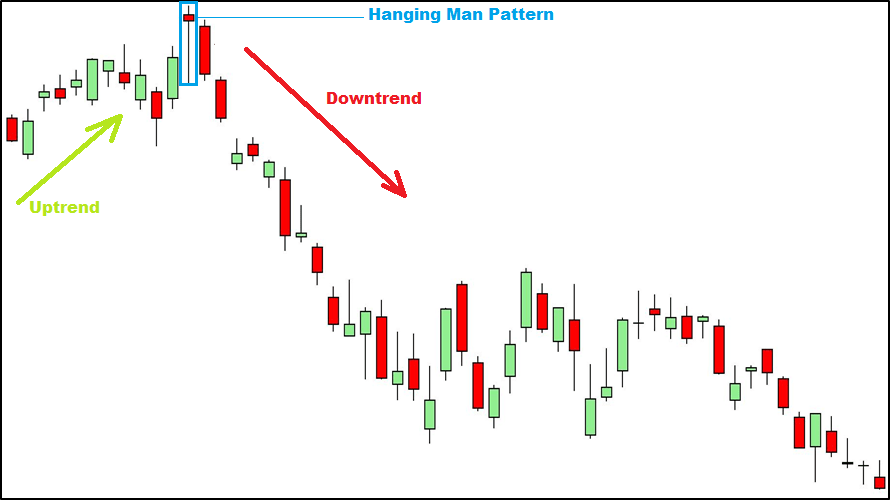
The hanging man candlestick pattern is the same as a hammer (bullish pin bar) candlestick. So what is the difference between the two?
Well, its this:
- hammer forms in a downtrend
- a hanging man forms in an uptrend
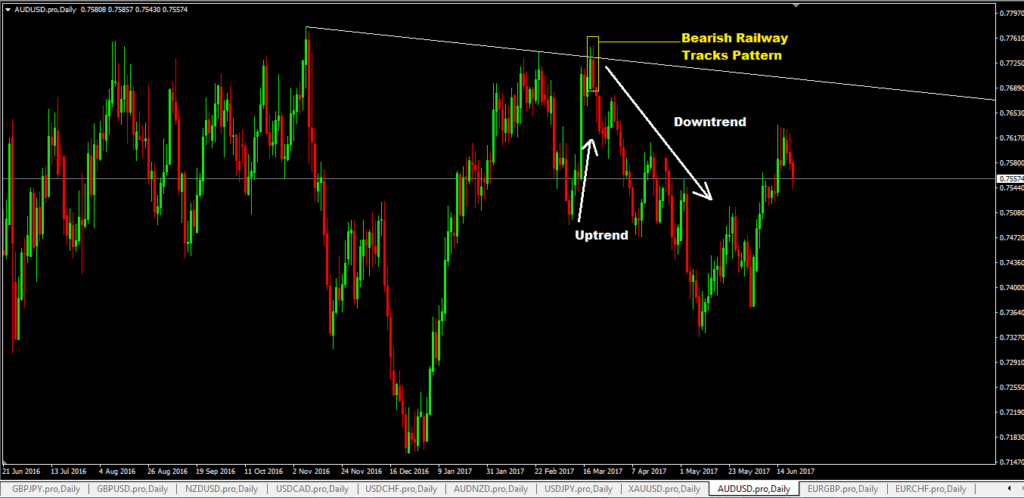
#7: Bearish Railway Tracks Pattern
- the bearish railway track pattern is a 2 candlestick pattern as shown on the chart below.
- the first candlestick is bullish and the second candlestick is bearish.
- both candlesticks must have “roughly” the same length and also their body lengths must also be roughly the same.
Bullish Reversal Candlestick Patterns
Bullish reversal candlestick patterns, when they form, indicate that the trend may be changing from bearish to bullish.
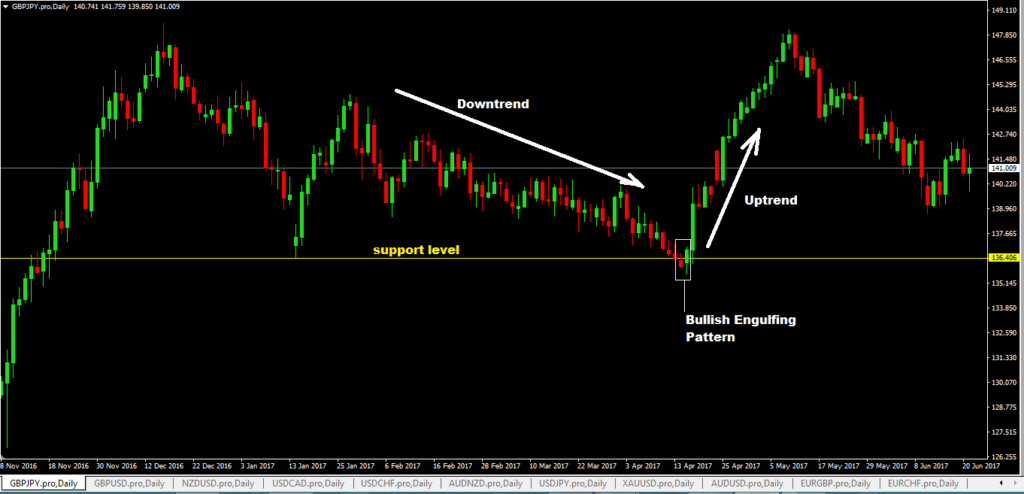
#8: Bullish Engulfing candlestick pattern
- the bullish engulfing pattern is the complete opposite of bearish engulfing pattern and when it forms in a downtrend is levels of support, it indicates the trend may be changing to an uptrend.
- this pattern is a 2 candlestick pattern as shown on the chart below.
- the first candlestick is bearish but the second one is bullish.
- the 2nd bullish candlestick completely engulfs the first candlestick( its highs and lows exceed that of the first candlestick)
- when you see this pattern in a downtrend when price hits levels of support, you should be looking to buy.
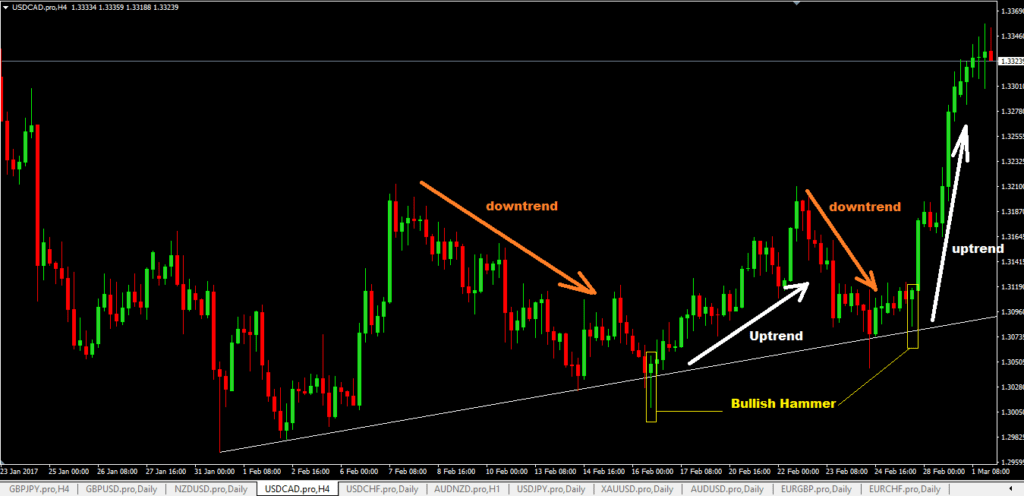
#9: Bullish Hammer Candlestick Pattern (Bullish Pin Bar)
- a bullish hammer that forms in a downtrend in support levels should be taken note of as this is a possible signal that an uptrend may be forming and you should be looking to buy on the breakout of the high of the bullish hammer.
- a bullish hammer is a single candlestick pattern.
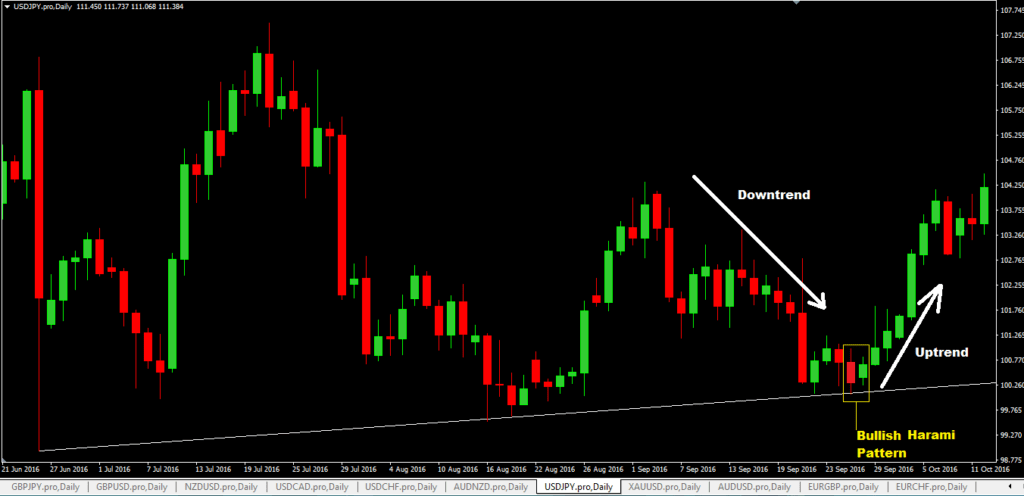
#10: Bullish Harami Reversal Candlestick Pattern
- a bullish harami pattern is 2 candlestick pattern…the first being bearish and the second is bullish.
- but the second candlestick is shorter and lies withing the shadow of the first bearish candlestick.
- if you see this pattern form in support levels as price hits them, you should be looking to buy.
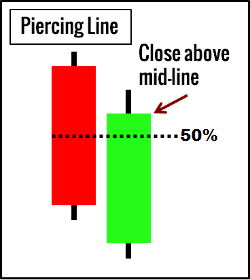
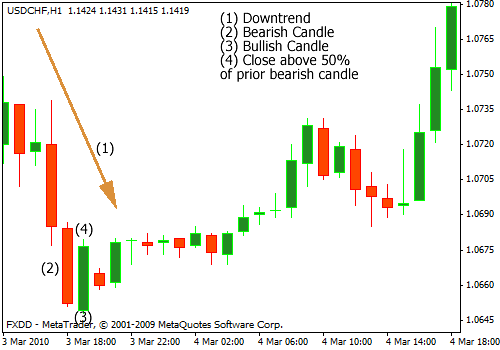
#11: Piercing Line Candlestick Pattern
- piercing line pattern a 2 candlestick pattern.
- the first candlestick is a bearish candlestick and 2nd candlestick is bullish.
- the 2nd candlestick must close at least 50% and above of the length of the first candlestick.
This is what a piercing lines looks like on a real chart:
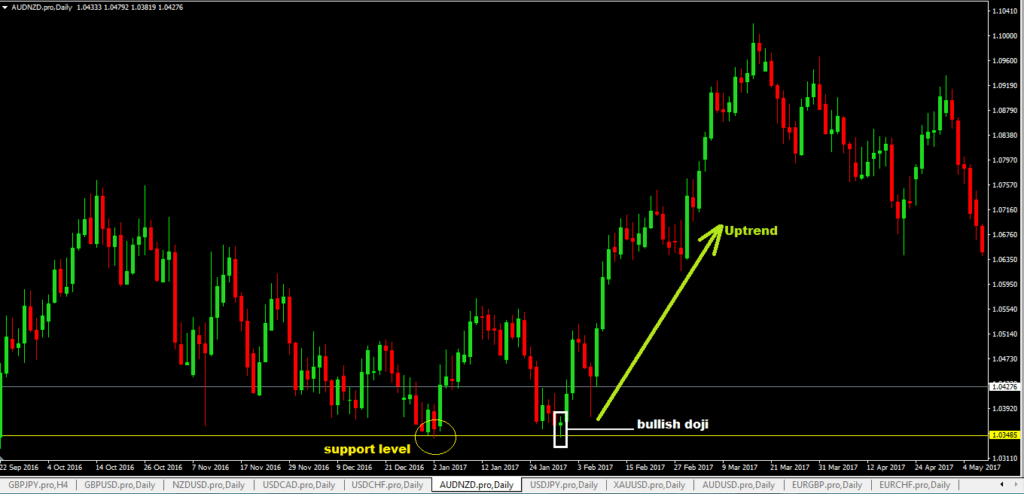
#12: Bullish Doji Candlestick Pattern
- if price hits a support level and a bullish doji forms, you should be looking to buy the breakout of the high of that doji candlestick.
- this is a one pattern candlestick.
Advantages of Using Reversal Candlestick Patterns As Trade Entry Signals
- You are trading based on raw price action as opposed to trading with indicators where almost all of them are derived from price.
- It makes it much easier to know where to place your stop loss based on those reversal candlestick patterns.
Disadvantages Of Using Forex Reversal Candlestick Patterns
- Reversal candlestick patterns are not the holy grail of forex trading. Price will go where it wants to go based on supply and demand so even you see a bearish pin bar on a resistance level, that does not mean price will go down. If more bulls (buyers) start coming in, that bearish pin bar means nothing as guess what happens next? Price will go up regardless of that candlestick!
- You don’t need all the 12 forex reversal candlesticks here to be able to trade profitably. The best thing is I think is to pick a few handful of candlesticks and be an expert and trading only these setups instead of the whole lot.
