The hedge fund forex trading system as the name is used by hedge funds…or maybe not? Or Maybe?
Either way, let’s say that it is a hedge fund trading system for now.
I actually saw this hedge fund trading system on the net and I though I’d put my own twist to it.
What Is This Hedge Fund Trading System?
- This trading system is a 100% price action trading system and it is based on the daily chart.
- you are supposed to use it as a swing trading system, meaning, you let your trades run for days with an aim to make hundreds of pips in profits.
- You can trade any currency pairs with it.
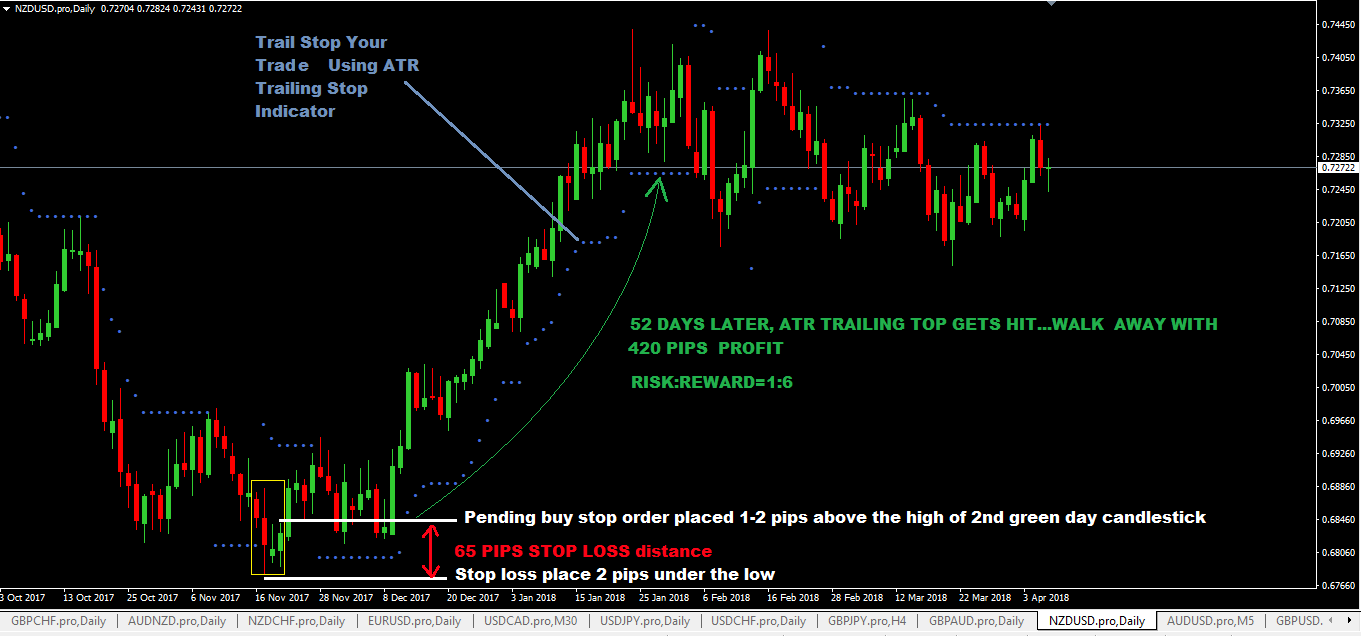
- The only indicator you need is for managing trailing stop loss: it is called the Average True Range Trailing Stop Mt4 Indicator (download link)
As I mentioned already, the whole idea of the hedge fund trading system is to capture the big market swings that move from 100-500 pips ore more in the forex market.
And the way to to do it is really simple and you need to follow only these two rules:
- trade using the larger daily timeframe
- and hang on to your trades for many many days or weeks until you get stopped out of your trade with a profit or you take profit target is hit.
With this hedge fund swing trading system, it can take only one trade to make 300 or 500 pips in a trade. And that can take a few days or one week or even more than one week. The fact that you are trading this trading system on the daily timeframe gives you the potential to achieve such huge profits whilst managing your trading risk properly.
Price Action Patterns Of The Hedge Fund Trading Strategy
The hedge fund forex trading system is based on a 4 candlestick pattern.
These candlesticks must form one after the other.
There’s a bearish pattern (sell pattern) and a bullish (buy) pattern.
Sell Pattern
A sell pattern is made up of 2 green days and 2 red days candlesticks:

Buy Pattern
For a buy pattern is made up of 2 red days followed by 2 green day candlesticks:

It is really simple, right?
Just getting a screen shot of the EURUSD daily chart, you can see the boxes of where I’ve picked the buy and sell signals generated on the daily chart:

Hedge Fund Trading System Rules
Here are the trading rules.
Buying Rules
- 2 red days and 2 green days means a buy signal
- when that happens, place a pending buy stop order 1-2 pips above the high of the 2nd day green candlestick or whichever the highest point is in of the 2 green day candlesticks.
- place your stop loss 2 pips below the low of the of the “box”
- Since you are looking to make 100 of pips profit by swing trading (letting your trades run for days and possibly weeks), do not set take profit targets, but used trailing stops to let the trade ride. You only exit a trade when your trailing stop loss gets hit
Selling Rules
- 2 green days and 2 red days means a sell signal
- when that happens, place a pending sell stop order 1-2 pips above the low of the 2nd day red candlestick or whichever the lowest point is in of the 2 read day candlesticks.
- place your stop loss 2 pips above the high of the of the “box”
- profit target should not be set for this trade but use trailing stop to ride out the trend

2 Ways On How To Avoid Choppy And Ranging Markets
Trading in the daily chart in fact allows you to reduce and minimize a lot of these choppy market behavior you will see when you switch down to lower or smaller timeframes like the 4hr, 1hr and below.
Here’s a fact:
- daily charts, just because they can be classified as larger timeframe does not mean the are immune to ranging or choppy markets…ranging and choppy markets can and will happen in daily charts.
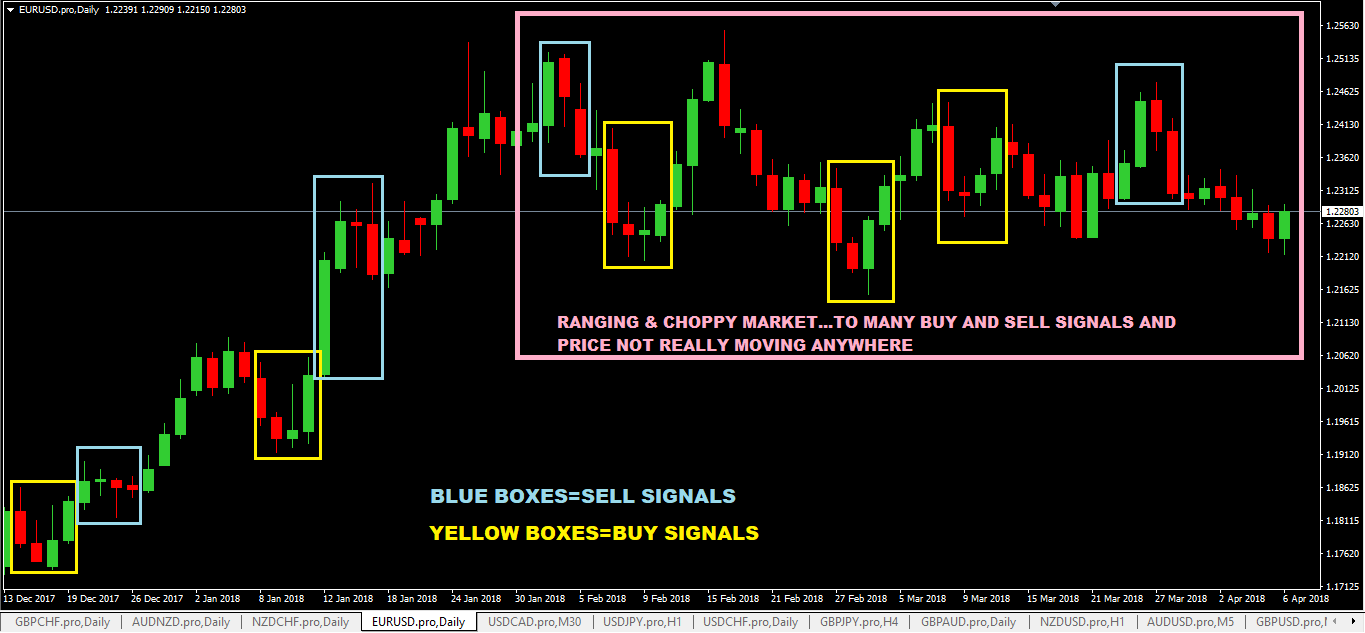
Here are a few suggestions to avoid trading in a ranging market. These will limit the number of trades you will take but at least you have the best chance to pick only the trades that have the potential to move hundreds of pips in a strong trend:
#1: Minimum of 3 Consecutive Red/Green days rule
This means that you must have at least 3 blue or red day candlestick form in a row and if a buy or sell signal forms after that, it is considered a valid signal.
Confused still? Let me give an example of what a buy trade setup based on the 3 consecutive day rule will look like:
Day 1=Red Day Candlestick
Day 2=Red Day Candlestick
Day 3=Red Day Candlestick
Day 4=Green Day Candlestick
Day 5=Green Day Candlestick
In this case, the buy signal is formed by the Day 2, Day 3, Day 4 and Day 5 Candlesticks.
Or it can also look like this for a valid buy signal:
Day 1=Red Day Candlestick
Day 2=Red Day Candlestick
Day 3=Red Day Candlestick
Day 4=Red Day Candlestick
Day 5=Red Day Candlestick
Day 6=Green Day Candlestick
Day 7=Green Day Candlestick
In this case, the buy signal is formed by the day 4, day 5, day 6 and day 7 candlesticks.
Now, looking at this chart below again, by applying the 3 day consecutive rule, you can see that many of the trades in the ranging market would have been avoided thus saving you a lot of grief:

The number of red candlestick that form does not matter as long as there’s more than 3 in a row and then after that you have 2 green candlestick days.
For a valid sell trade setup using the 3 consecutive day rule, its the same thing but this time, you need a minimum of 3 green candlestick to form in a row and then after that you must have 2 red candlesticks and that will classify as valid sell signal.
Does it only have to be 3 day rule?
No, you can pick more than 3 days. Pick 7 days in a row, as an example, but here’s the problem:
- the more the number of days you pick, the less you will have buy and sell signals generated for you to trade!
So what is a better number then?
In my opinion, I think you need to work with only 2 numbers…3 or 4 and select one of them.
I’d go for 3!
#2: Understand What Type Of Market You Are Dealing With
This can be hard for a new forex trader to get easily but after some time, you will understand.
You see, you want to get into a trade when you know and can see that the price is trending nicely.
The only way to do this using strictly price action is by watching for these two patterns:
- When a market is trending higher, it will be making higher highs and higher lows.
- When a market is trending lower, it will be making higher lows and lower lows.
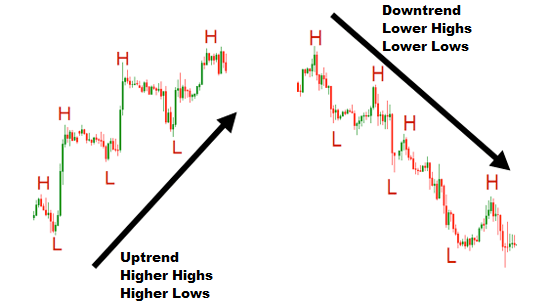
That is the kind of structure you want to see and if that structure starts to become “confused”, you know, you may be entering a ranging market. When that happens, don’t trade.
They say the best trade is a trade not placed!
The subject of trend trading, trend identification etc is a big subject of its own and I don’t have the time to include it here but maybe one day I will get down it and write about it.
My forex price action trading course covers it and there’s a section on it so check it out.
Advantages of The Hedge Fund Trading Method
- big profits
- less stressful way to trade, all you need is a few minutes a day to to check and adjust your trailing stop loss for a trade that is in profit
- you don’t need to spend a lot of time in front of the computer which means it a very good forex trading system for those that have day jobs or even a stay at home mum who is so busy looking after 5 children!
- trading on daily timeframes reduces a lot of noise that is found in the lower/smaller timeframes.
Disadvantages
- you need to have a lot of patience to sit through those periods where you see price reversing/retracing and eating into your profits.
- You may not find a lot of trading opportunities if you specifically focus on trading only one or two currency pairs. Therefore I suggest you have at least more than 10 currency pairs to scan daily and look for trading opportunities
- not many traders will have the patience to sit idle most of the time and wait for trading setups to form and this trading system, the way it is setup is won’t be pumping out buy and sell signals daily so if you are trader that likes action, this system is not for you.