The Higher time frame Candlestick Overlay Indicator MT4 displays the price action of several larger time frames, on a lower time frame chart.
For example, you have 30 minute candlestick chart open and you also want to know what the price action is looking like in the 4hr chart instead of switching back and forth between those two timeframes, all you need to do is just use the higher timeframe candlestick overlay indicator.
Higher Timeframe Candlestick Overlay Indicator MT4 (What It Does)
- Works on all timeframes as long as the timeframe you choose is larger than the one you are attaching it to.
- It works on any currency pairs
- It displays all the candlesticks informative like the body and wick, open, high, low, and close prices of the larger timeframe.
- Non-repainting indicator
- The colors of the indicators can be changed to whatever color you want
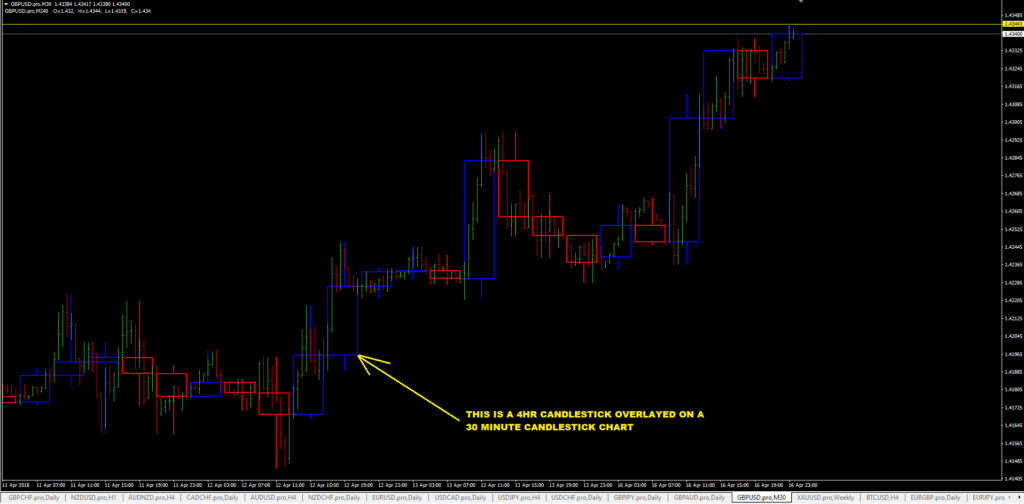
Here’s an example: on the chart below, you have a 30 min candlestick chart which has been overlayed with the higher timeframe candlestick overlay indicator.
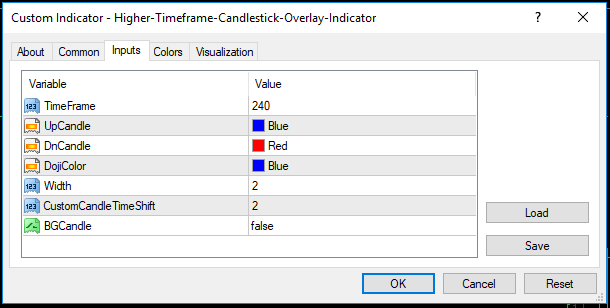
Inputs
- Timeframe = The larger timeframe you want to show on the smaller timeframe chart. By default, it comes in a 4hr chart (240mins). If you want a daily chart overlay, you have to change it to 1440. Or you want a 1 hr chart overlay, you change the value to 60 (for 60 minutes)
- UpCandle = Bullish candlestick. The default color is blue but you can change the color to green or whatever color you want.
- DnCandle = Bearish candlestick. The default is Red. Change it to whatever colour you want or you can just leave it as it is.
- DojiColor = If a dojit candlestick forms, since the closing price is the same as the opening price, it will just be given a blue color by default.
- Width = I don’t know what that one does, you need to find out yourself.
- CustomCandleTimeShift = I don’t know that one either. Explore and find out.
- BG Candles = If you click yes to this, it will color the candlestick Background so you have “solid” candlesticks instead of “hollow candlesticks.”
How To Trade With The Higher Timeframe Candlestick Overlay Indicator
- A very good indicator for multiple timeframe analysis and trading
- It allows you to see the bigger picture so that you can see the underlying trend
Ok, here’s the download link for the candlestick overlay indicator: Higher-Timeframe-Candlestick-Overlay-Indicator