In this article, you will learn:
- What are bull traps in Forex?
- The 2 types of resistance levels on the chart where bull traps may form.
- The 2 types of patterns to look for in bull trap trade setup.
- How to trade bull trap chart patterns and the candlestick patterns that you should be watching out for.
What Are Bull Traps In Forex Trading?
A bull trap in forex simply refers to a bearish signal that forms in an uptrend that catches unsuspecting bulls (bulls=buyers), who have bought into the uptrend move thinking that the price will continue to go up.
In other words:
- Prices make a move upward and buyers think that price will continue going up so they start buying.
- Doon, the price reverses direction and starts heading down!
- The buyers are now trapped. They can see that the price is heading down and their stop losses are about to be hit. They suffer a trading loss.
A bull trap is simply a false upward move that reverses soon after, and traps buyers into a loss-making trade.
The Sequence of A Bull Trap Formation
The following are the 4 main things that follow in the sequence leading up to and after the formation of a bull trap:
- A strong resistance level must be present.
- Price breaks the resistance levels and goes up. A pretend upward move, in other words.
- Later after the upward price breakout, price action shows an extreme bullish rejection which can result in a candlestick closing below the resistance level again or slightly above it.
- Once that false upward move or the bull trap move happens, the price follows through and continues to head down.
Where Do Bull Traps Form On A Chart?
This is the easy part. When I trade, I watch out for potential for bull traps on resistance levels. Got that? Resistance levels.
There are two main types of resistance levels where bull traps have the potential to form which I will show you here.
I have witnessed a lot of bull traps on resistance levels. I have also been on the wrong side and have been caught out many times with bulltraps.
I’m not going into detail about the reason or reasons behind why the bull trap chart pattern happens. That is not the aim of this article.
So what two types of resistance levels can bull trap chart patterns form?
- The “normal” resistance level.
- Support level broken-turned resistance level.
The “Normal” Resistance Level Bull Trap Formation
A normal resistance level is the one most traders would be familiar with. It is the price peak that stands out. The thing with these resistance levels is that they are very obvious, which means every trader can see them.
For every resistance level like that, there’s always the potential for the bull trap to form.
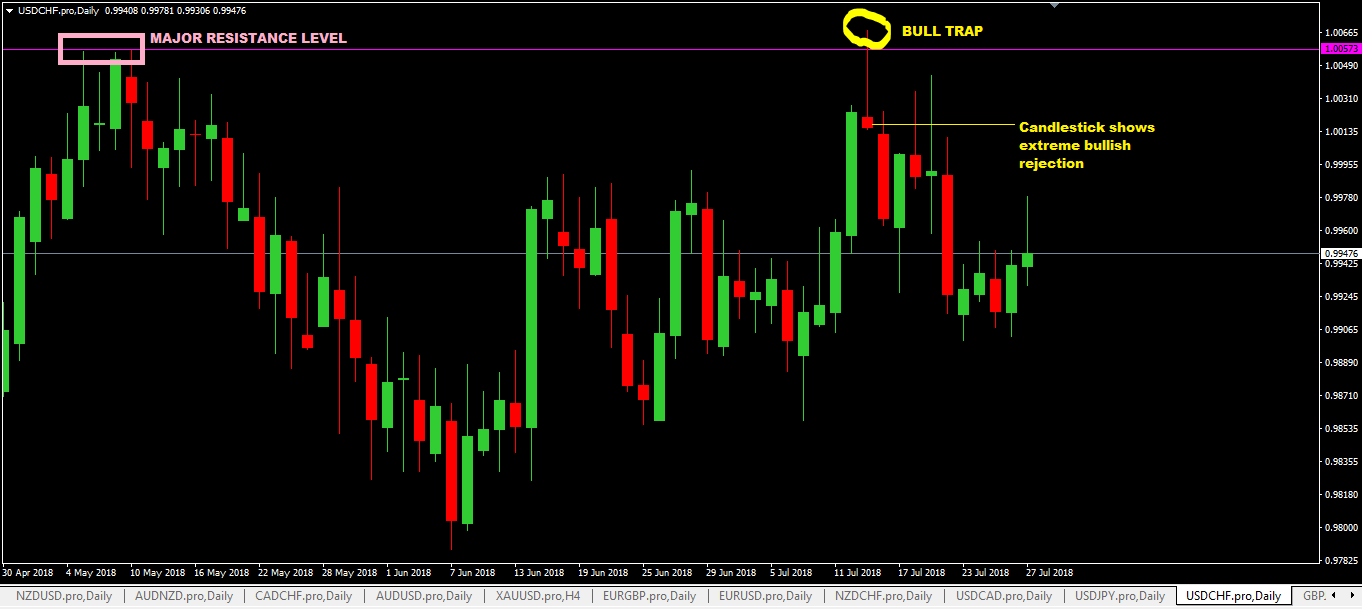
On this daily chart of USDCHF shown below, this is what I call a “normal” resistance bull trap setup. And you can see how this bull trap pattern has played out.
Note the shooting star candlestick. (A very bearish candlestick indeed). Note also that it closed below the resistance level.
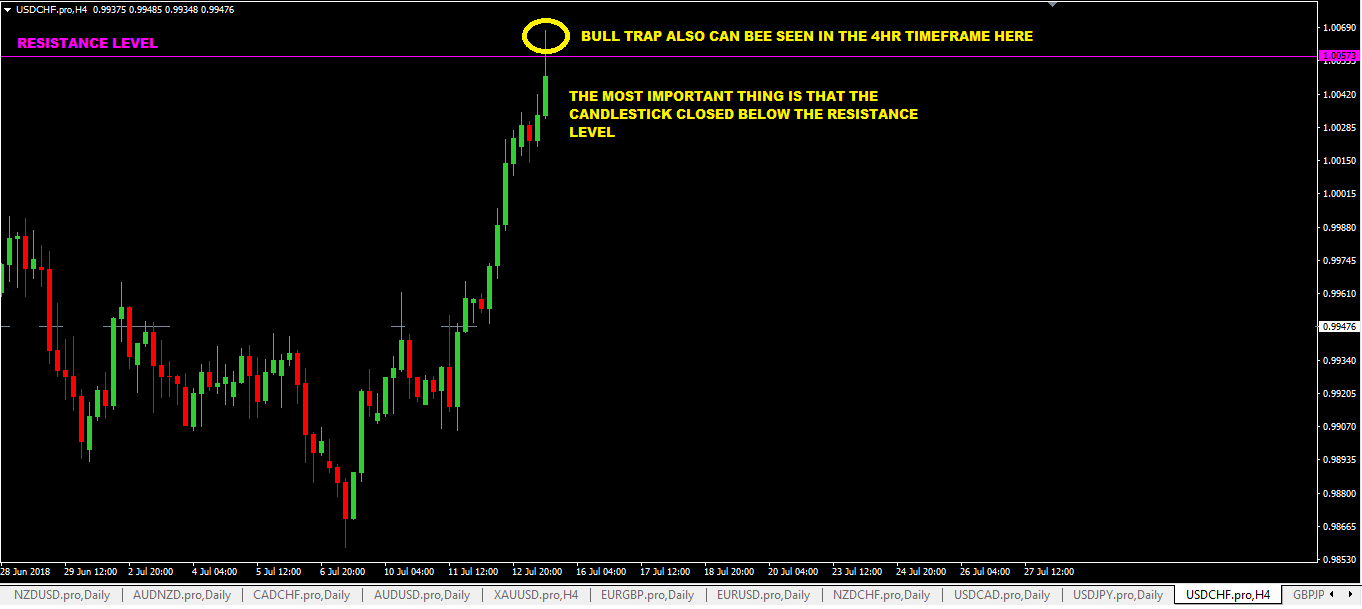
How would this bull trap pattern look if it was forming in the 4hr chart?
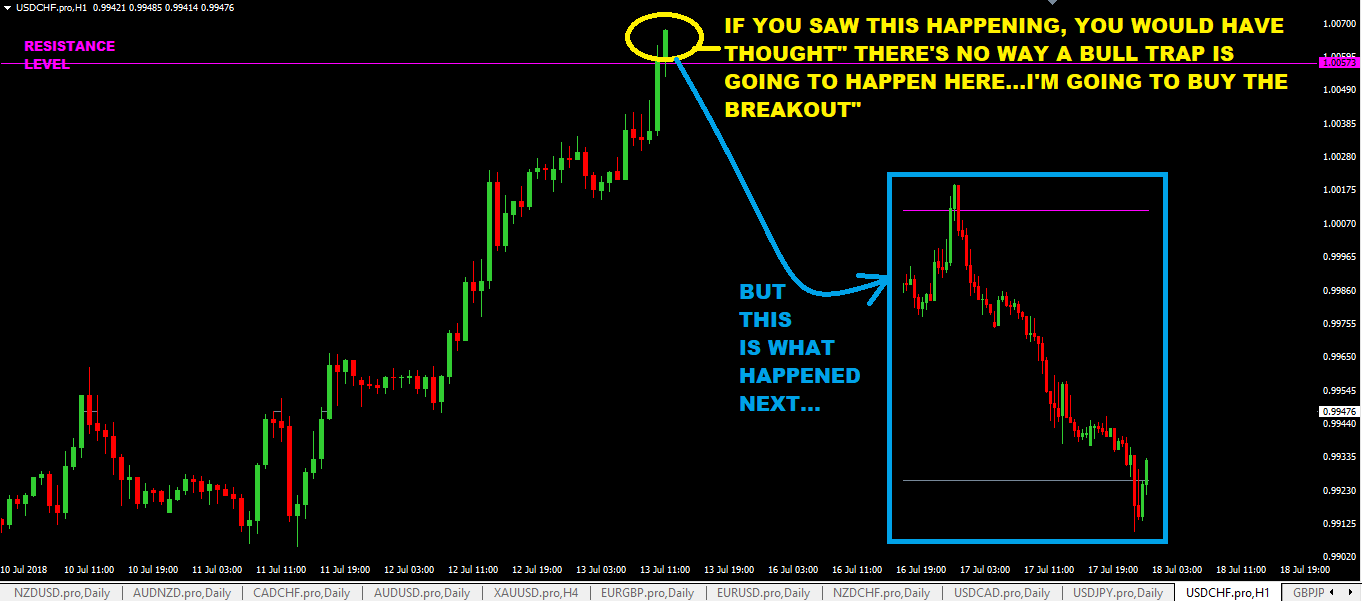
Can we see a bull trap in the 1hr timeframe?
I’ve shown you 3 different timeframe views of the bull trap setup as it was forming. What is important to understand here is that:
- In the larger timeframe charts like the daily and 4hr, you can easily see that there was a bull trap pattern formation.
- But in the 1hr timeframe, many traders would have thought that a real breakout was happening and would have bought into the upward price move. Only to be left scratching their heads in wonder why the price changed direction so suddenly soon afterward.
So these traders that bought, have now become trapped in a losing position. Soon their stop loss will be hit.
That’s why I never like trading breakouts. I’d rather wait for a retracement and then buy onto that upward move.
Anyway, that is a topic for another post someday but there are two main reasons why I don’t like trading breakouts:
- Often, the price would have traveled a long distance before the breakout happened. I tend to doubt if it would have the “energy” or the steam to continue to move in the breakout direction.
- If it didn’t have the steam to carry on in the breakout direction, bull traps and bear traps are prone to happen and I don’t want to get caught in it.
I am a reversal trader. When traders are buying on breakouts, I wait for bull traps and bear trap setups to form to trade in the opposite direction. The following 12 forex reversal candlesticks help me in my trade decision making process.
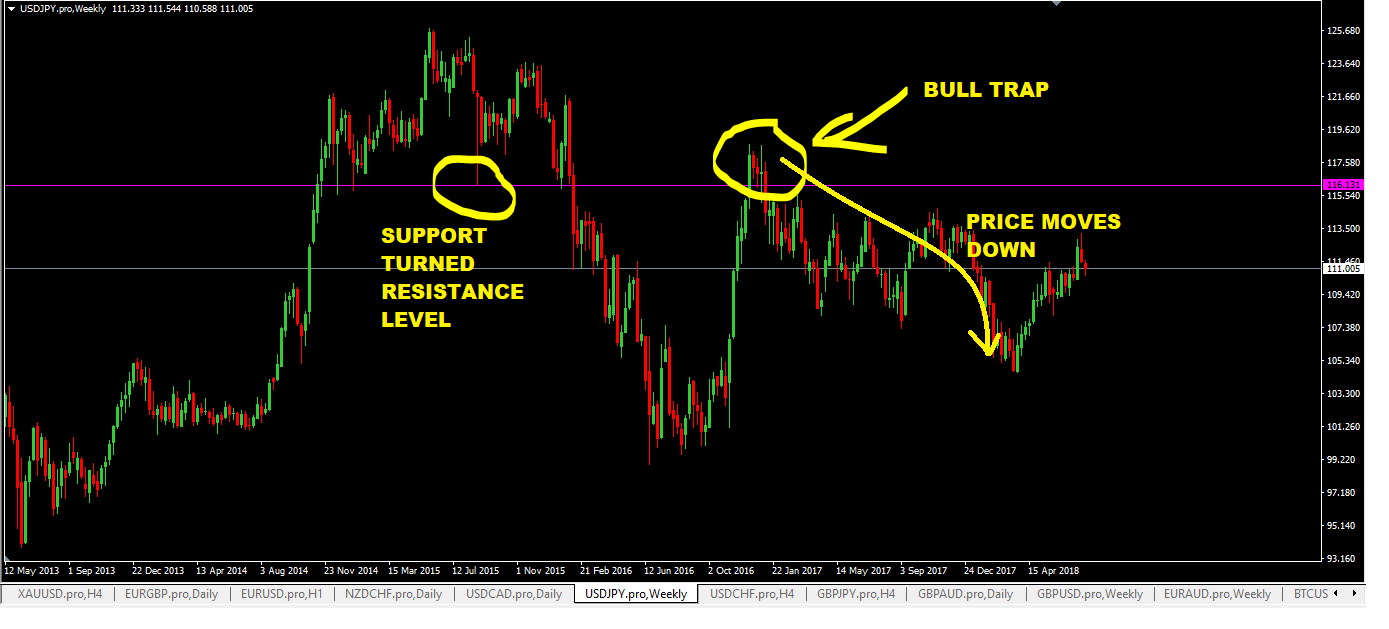
The Support Level Broken Turned Resistance Level
What is a Support Level Broken Turned Resistance Level? This level is a potential resistance level that happens when a major support level is broken and breaks goes all the way down but at some stage, it will start moving back up.
But this time, this broken support level generally tends to act as a resistance level. You tend to see this happening a lot in forex.
This is the 4hr GBPJPY chart showing how a support level that has been broken has acted as a resistance level once the price came back to it.
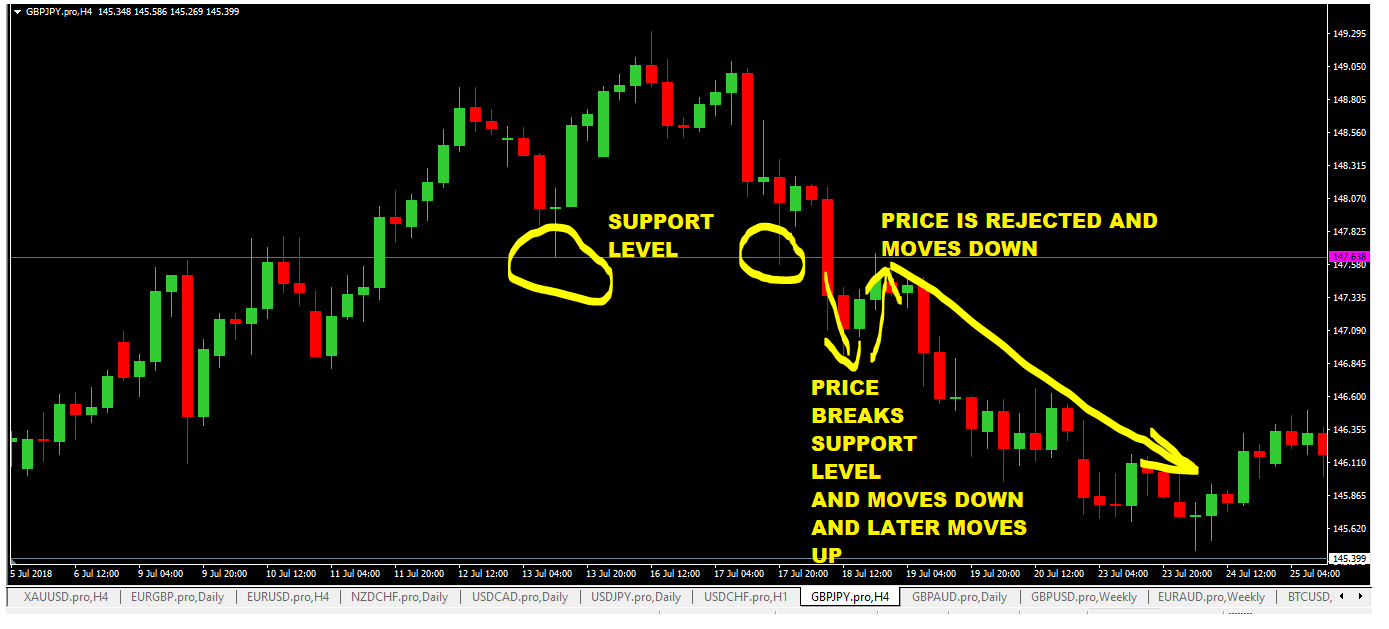
And this chart below shows, how a bull trap setup based on a support turned resistance level:
How To Spot Bull Traps Setups From multiple timeframes
Here’s a fact, a bull trap setup can form right before your eyes and you wouldn’t know it. Why? Because of the timeframe that you are using.
Different timeframes give you a different perspective of what price action is doing.
Generally, I rely on the 4 hour and the 1 hour charts to watch for bull trap setups. I switch back and forth between them to see what price action is telling me. I find them more reliable. Smaller timeframes tend to cover up what is happening in the larger timeframe.
I’ve shown you an example of this happening in the USDCHF chart on the daily, 4 hour and 1 hour above.
When the price hits a resistance level and if you are watching it in a 1 minute, 5 minute, 15 minute or 30 minute charts, you will see these candlesticks closing above the resistance line and you be like:

Watching resistance levels being broken and candlesticks closing above it using smaller timeframes can be misleading.
Take a step back and watch in in the 1hr or 4 hr timeframes or even the daily and you can see what is really happening.
The Two Types of Bull Trap Setups That I Look For
There are two main bull trap setups that I look for and they are predominantly based on price action using reversal candlesticks and secondly, where these candlesticks close in relation to the resistance level.
The close of the daily, 4 hour or the 1 hour candlesticks can really set the tone for how the price will behave after that. A close of a candlesticks below the resistance level is a more reliable signal than the one that closes above or slightly above it.
Let’s look in detail at these two types of bull trap setups…
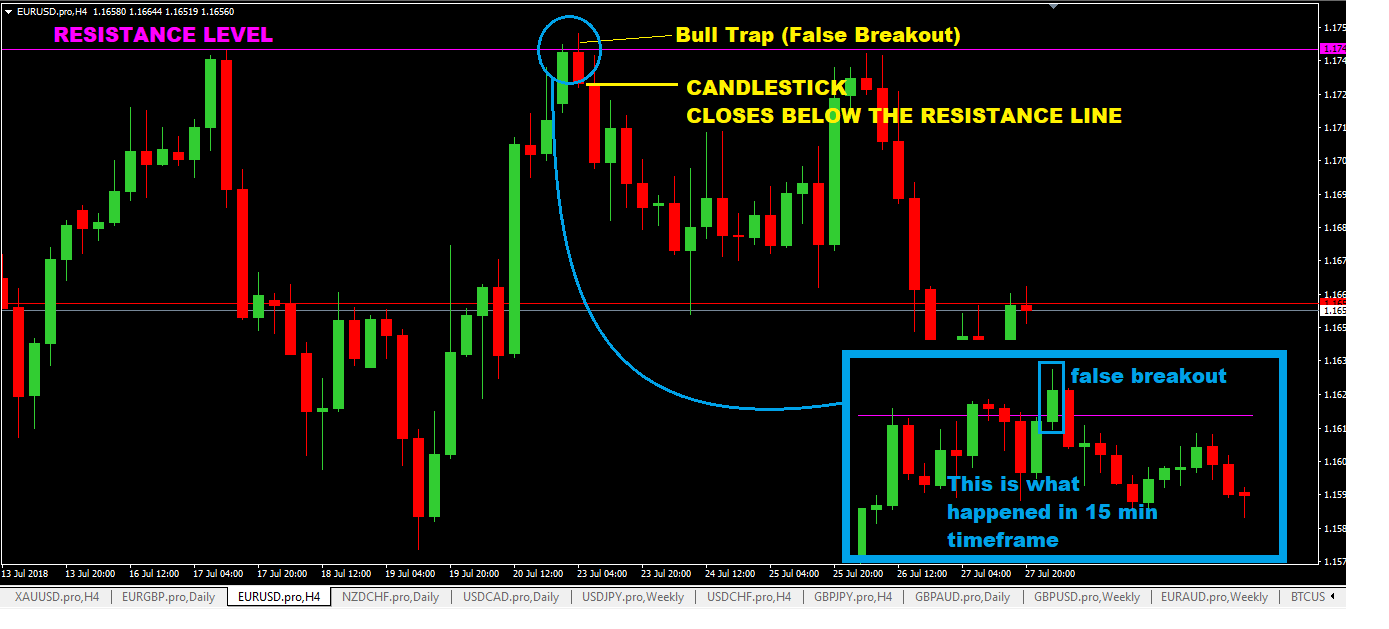
Bull Trap Pattern Setup 1: Candlestick Closes Below The Resistance Line
In this setup, you will see:
- A candlestick, usually an extremely bearish candlestick has its high above the resistance level.
- It must also have its close below the resistance line.
- The fact that the candlestick closes below the resistance line sends a strong message to all the traders to start selling.
- Many traders who were long (buying) before starting to bail out or their stop losses are getting hit and they may start selling as well.
What tends to happen after it, is the price starts moving down at a much faster rate.
Here’s a chart example of this:
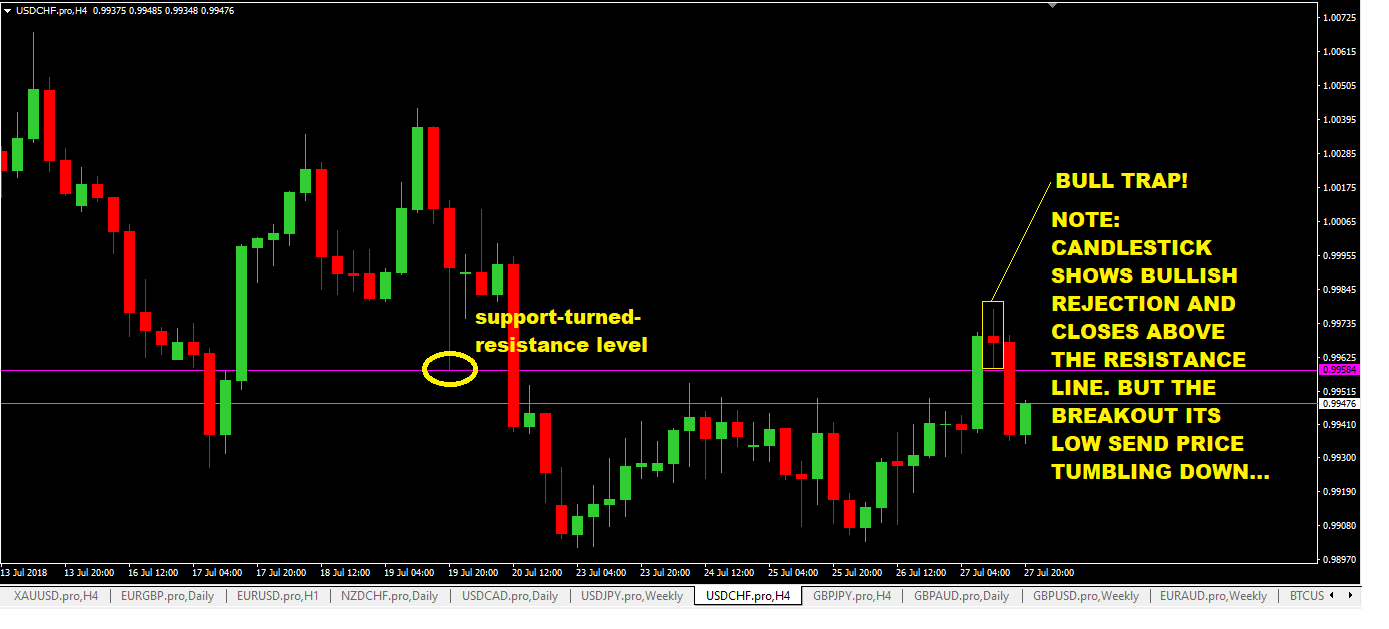
Bull Trap Pattern Setup 2: Candlestick Closes Above The Resistance Line
In this setup, what you will see is:
- Price breaking above the resistance line and you will see candlestick showing bullish rejection.
- The high of the candlestick will be made above the resistance level.
- Its low can be above or below the resistance level.
- But it will close above the resistance level.
The important thing is what type of candlestick it is. So you need to know the 6 of the bearish reversal candlesticks here. These will help you.
The breakout of the low of this bearish candlestick tends to result in prices moving down.
Here’s an example of what I’m talking about:
How To Trade Bull Trap Chart Patterns
So how do you trade bull trap trade setups then? The trading of the bull trap trade setups or chart patterns is the easiest part of it all, if you know how to spot bull traps forming.
Here’s how:
- You need to identify a strong and obvious resistance level
- If the price breaks that resistance level, don’t get into a buying frenzy…just wait for your bearish reversal candlesticks in the daily, 4 hour, or on the 1 hour timeframe.
- Place a pending sell stop order 1-2 pips below the low of that candlestick.
- Place your stop loss 2-5 pips above the high of that candlestick.
- For take profit, look for previous swing lows that have a risk/reward of 1:3 or better and use that as your take profit target level.
So what about the 12 reversal candlesticks you need to trade bull trap patterns? I’ve already given you the links in this article. Check them out.
SUMMARY
Let’s recap what I’ve covered so far in this article:
- A bull trap is a bearish reversal signal that happens in an uptrend.
- Bull traps have the potential to form on resistance levels.
- There are two types of resistance levels, the “normal” resistance levels and then the 2nd type of resistance level where a broken support level now acts or becomes a resistance level.
- Smaller timeframes can hide the bull trap setup that is forming on the larger timeframes like the daily, 4hr, and the 1hr. So it’s better to switch between these timeframes to see what is happening to get the “big picture.”
- There are two types of bull trap setups that are based on the closing price of the candlesticks in relation to the resistance line. The close of candlesticks above or below the resistance level does have an impact on how the price behaves. The best signal is when the reversal candlestick closes below the resistance level.
Make these 12 forex reversal candlesticks your best buddies on how to spot and trade bull traps.