What are range candlesticks or range bars or range charts?
Now, l admit I do not trade using range bars or range charts but this topic has been something that has been at the back of my mind for some time so I decided to dig into it a little bit more. And what I have found is quite interesting and I’m now really seriously thinking about changing from time-based charts like the candlestick chart to range chart trading.
Why? I hate consolidation and price whipsaws and spikes that are so prevalent in time based charts. I’ve had my stop loss taken out countless times only to see the price move in the direction of my trade after my stop loss has been hit.
It is frustrating. If only there was another way to trade and avoid that, wouldn’t that be awesome?
Well, thanks to this trader by the name of Vicente Nicolellis, that is now a reality.
You see, when you execute a trade, two things can happen:
- The price seems to go nowhere simply because there is no significant move up or down and you are stuck there watching your trade that is not going anywhere. Trading in such a situation can be extremely frustrating. This is not the kind of market that you want to be trading in.
- Price really moves over a large range of values either up or down and when you trade in such a situation as this, you will know relatively quickly that your trade is going to be a loser or a winner because your profit target gets hit or your stop loss gets hit fairly quickly. This is the kind of market where forex traders prefer to trade in.
There is only one word that describes the two situations given above in the forex trading world and that word is volatility.
The first situation describes a low-volatility situation, and the second situation is an example of a high-volatility situation.
The Definition of Volatility in Forex Trading
Well, volatility is the level of fluctuation of price in a currency pair.
The price of a currency pair with a high volatility will travel in a larger range in a given time period compared to a low volatility currency pair. If the average daily range of GBPJPY is 150 pips and 50 Pips for NZDUSD, which currency pair has more volatility then? Obviously, its GBPJPY.
On a similar token, which currency pair will have more volatility in Asian forex trading session, USDJPY or EURUSD? It will most like be USDJPY because during the Asian forex trading Session, USDJPY tends to be traded a lot as this is when Asia wakes up to trade.
But here’s the thing: volatility cannot tell you what direction the price will move. Trading when volatility is high is what traders look forward to but what happens when volatility is low when price enters longer periods of consolidation? How do you deal with that? A period of low volatility results in price consolidation.
So how do you know if the consolidation has ended and you can start trading again? The good news is this: there are few ways to deal with choppy markets and one of them is by using Range Candles or Range Bars as some call it.
History Of Range Bars
Trading during a price consolidation phase is a really frustrating thing for many traders. This was the same problem a Brazilian trader and broker by the name of Vicente Nicolellis had whilst trading the local market in the 1990’s.
Vicente Nicolellis was trading a market that was very unstable and also unpredictable and so there will be longer period of time when the market will be traveling sideways or doing what is called a consolidation phase.
There was no way he could achieve some level of predictability of the market if he was going to use charts where price bars or candlesticks were created based time: for example, if you have a 1 minute chart of EURUSD, each bar or candlestick that you see there reflects the open, high, low and close prices within that 1 minute. After that, the next 1 minute candlestick forms…and the process continues.
After a careful and lengthy study, he concluded that if he eliminated time from the formation of the bars, that would tame the volatility issues he was facing. So that’s exactly what he did! He developed a price bar that only used price. Now, you are wondering: how? Well, this is how:
By making sure that a bar is formed only when a specified price range has been achieved. This eliminates the time factor in the formation of bars. The result of doing this is that a very long time period of price consolidation can be condensed into just a few bars, thus removing the noise in the market. That is how Vicente Nicolellis became the creator of range bars.
What Are Range Bars?
Range bars (range candlesticks) are price bars that take only price into consideration without the need for time.
A normal candlestick price chart is time based, which means there are two axis:
- in the x-axis you have time
- and the y-axis, you have price, like this chart shown below:
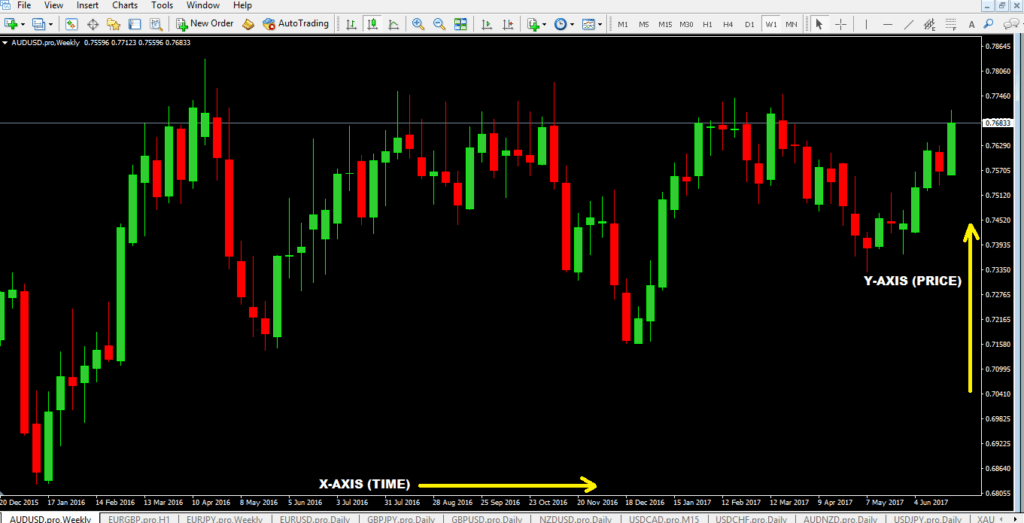
A range bar on the other hand is simply made up of price.
Yes, time will be present on the chart but it is relative. In other words, time is not relevant. This means that a range bar chart is not linear. Let me explain what linear means here:
In a normal range bar chart or a candlestick chart, a candlestick forms only after a certain period of time. On a metatrader 4 chart, you have 9 different timeframes from the smallest timeframe of 1 minute up to the monthly timeframe.
For example:
- if you are in the one minute chart and watching it, a complete candlestick forms only when the one minute is complete.
- So in a 5 minute period, you’ll have five 1 minute candlesticks and so forth.
This is what linear means: there’s always a new candlestick forming after 1 minute (for example).
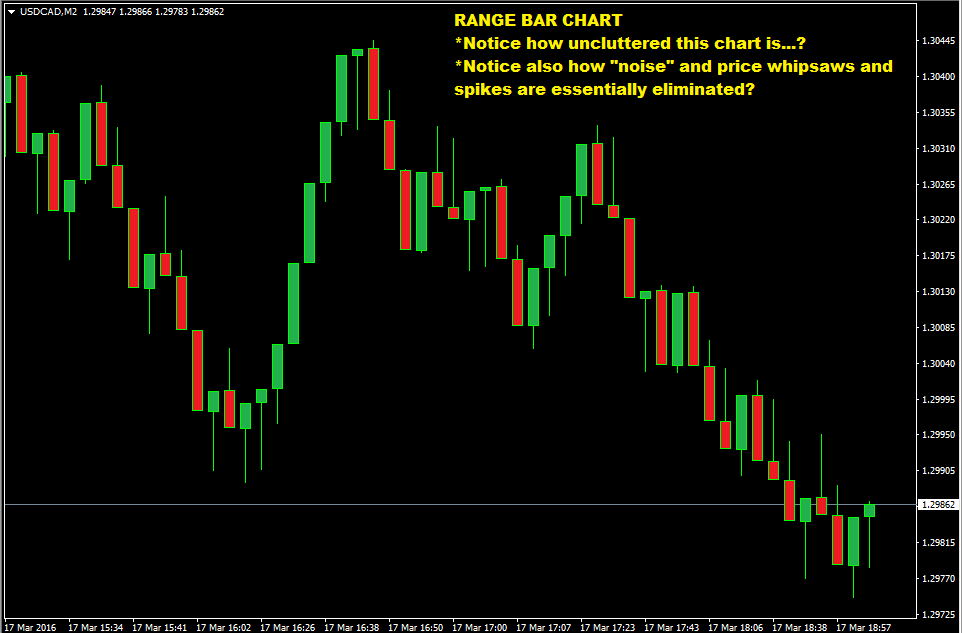
Now, on a range bar chart. You don’t have this linear phenomenon because as I said above, time is not a factor for the calculation of a range bar. A range bar only forms when a specified range of price is achieved.
For example, if a specified range of 10 pips is desired than the next bar will form only when price makes the 10 pips range.
So what do you think will happen if (for example) no 10 pips range is made during the last 5 hours? Answer: no new range bar will be formed.
So as you can see, this is a non-linear type of chart. The chart shown below is a 10 pip range chart of USDCAD.
Calculating Range Bars
Range bars take only price into consideration. This means that each bar that forms represents a specified movement of price.
You may be familiar with viewing bar charts based on time; for instance, a 15-minute chart where one bar shows the price activity for each 15-minute time period. Time-based charts, such as the 15-minute chart in this example, will always print the same number of bars during each trading session, regardless of volatility, volume or any other factor.
Range Bars, on the other hand, can have any number of bars printing during a trading session:
- during times of higher volatility, more bars will print;
- conversely, during periods of lower volatility, fewer bars will print.
The number of range bars created during a trading session will also depend on the instrument being charted and the specified price movement of the range bar.
Three rules of range bars:
- Each range bar must have a high/low range that equals the specified range.
- Each range bar must open outside the high/low range of the previous bar.
- Each range bar must close at either its high or its low.
Range Bars On MT4 Trading Platform
So do range bars come in the MT4 trading platform? Unfortunately no. You see, range bars are not a default part of the mt4 trading programs so to trade range bars on mt4, you need to use an indicator or an expert advisor.
Here are some trading videos on YouTube that help you do that:
Video #1: Using Range Bar Indicator On Mt4
Video #2: How To Make Range Bars on Metatrader 4
How To Read Range Candles
Reading range candlestick information is no different from reading any other candlestick chart except that time is irrelevant.
The next thing to remember is that every range bar will be of the same length because the range will be constant. For example, if you specify a 10 pips range, every bar that forms will have a length of 10 pips.
Range Chart Vs Candlestick Charts
To really see the difference between a range chart vs a normal candlestick chart, we have to compare the exact same charts of both side by side.
Here is a 4h chart of EURUSD:
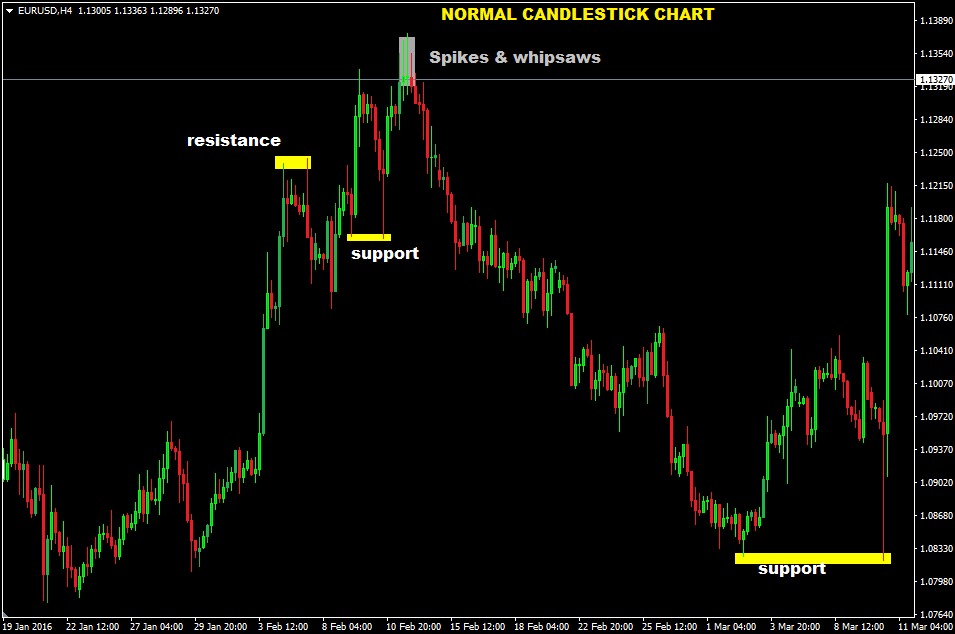
Here is the 50 Pip Range Chart of EURUSD showing the same details of the above:
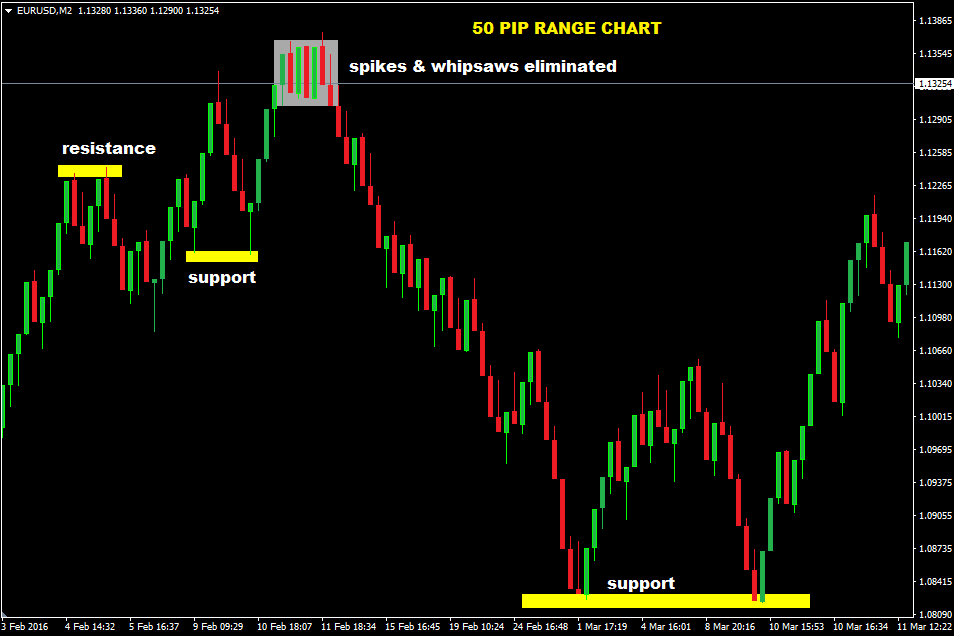
When you look at the two charts above, you can see there is a lot more clarity in the range bar chart than the normal candlestick chart:
- resistance and support levels are much more clearer, which means chart patterns like double tops and double bottoms are much more clearer
- you didn’t have to wait for the 4hr chart to close before seeing the double bottom chart pattern on the chart above.
How To Trade Range Charts And Candlesticks
Trading range charts is no different than trading normal bar charts and candlestick charts. You can pretty much use the same type of forex trading strategies that and systems that you use on a normal time based price chart.
Benefits Of Range Bars
What are the real benefits of trading with Range charts? Range charts do not use time in the formation of a range candlestick and only focus on on thing only: price action. So if price does not move, the chart does not move.
So the benefit is this:
- non-trending markets are filtered price whipsaws are avoided.
- range charts become really good charts for drawing trendlines
- areas of support and resistance can be easily emphasized with the use of horizontal lines on charts
- trends, reversals, pullbacks are much more clearer on range charts
- allow you to stay in a trade and ride the trend for as long as possible.
Disadvantages of Range Bars
Range bars sound like a price action traders dream. While this may be true to an extent, range candlesticks have one main disadvantage: they are not useful for OHLC (Open High Low Close) analysis. Why is that?
Because it i based on how the range bar or candlestick is calculated: you specify each range bar to break once it exceeds the specified range, so the bars always close at the extreme top or bottom. Because of this artificial close, most candlestick patterns like the forex reversal candlestick patterns are ineffective on range charts.
Which means that any forex trading system that is based on some candlestick patterns like the: inside bar, outside bar, and bullish / bearish engulfing patterns, cannot be used when you trade on range bars.
However, you will notice on the range bar chart above that, candlesticks like the bearish and bullish pin bars can be easily identified and traded.
Summary
While range bars are not a type of technical indicator, they are a useful tool that forex traders can employ to identify trends and to interpret volatility. Since range bars take only price into consideration, and not time or other factors, they provide traders with a new view of price activity.
Spending time observing range bars in action is the best way to establish the most useful settings for a particular trading instrument and trading style, and to determine how to effectively apply them to a trading system.
With Range bars or range charts:
- There is less noise in the charts as choppy price action is reduced and price spikes are eliminated.
- The charts clearly show price action and price formations and chart patterns.
- Trading setups appear earlier than with time based charts.
- Can be used with existing indicators and forex trading strategies